
The Heatmap Problem
After wrapping up an MD-3 training session at an MLS NEXT Academy club, I pulled up the GPS data and felt good about what I saw. Total distance (TD), sprint distance (SD), and high-speed running (HSR) had all hit our group benchmarks. On paper, the session was a success. Then I looked closer at the individual players and realized I was wrong.
Several players had blown well past our targets, accumulating loads that put them at real risk of a soft-tissue hamstring injury before the weekend. Others had not come close to the marks they needed to hit to be match-ready. The group average had told me everything was fine. The individual data told a completely different story. Acting on that difference was the only thing that stood between a clean week and a player pulling up on the training pitch.
That gap between what the group average shows and what each individual player needs is the problem this guide is designed to solve.
GPS systems like PlayerData EDGE generate vast amounts of data, but data does not manage players. Coaches do. Working at an MLS NEXT Academy, we used EDGE not just as an injury prevention tool, but as a day-to-day decision-making system for load management, recovery monitoring, and individual performance development. The difference between using GPS well and using it poorly comes down to one shift: moving away from team averages and toward individualized loading blueprints built around each player’s specific demands, history, and role.
This is a practical guide to making that shift so that every player’s needs are accounted for, no one falls through the cracks of a clean-looking average, and your GPS data starts driving real decisions.
The Foundation: What You Need Before the Data Means Anything
Establishing Individual Baselines
Before any GPS metric becomes actionable, you need context. Context starts with the individual, not the group. Team averages are a useful starting point, but they become misleading the moment you apply them universally. A 28-year-old center back and a 19-year-old attacking midfielder operate under completely different physical demands, and treating them against the same benchmark is a shortcut that eventually costs you a player.
Position is the first variable to account for. Research consistently shows that center backs cover approximately 9.2 km of total distance per match and produce the lowest high-intensity running output of any outfield position. They average around 681 meters of high-intensity running per game (Baptista et al., 2019; CIES Football Observatory, 2022). Attacking midfielders, by contrast, average closer to 10.6 to 10.9 km of total distance per match with substantially greater high-speed running and sprint demands (CIES Football Observatory, 2022). Applying the same weekly loading benchmark to both positions does not just produce inaccurate data. It produces dangerous data. Before you can identify whether a player is over- or underloaded, you need a baseline built around what their position demands, layered on top of their individual physical capacity for their age group.
Building the Baseline
The foundation of any individualized loading system is a reliable chronic workload reading. Hulin et al. (2016) established that chronic load, calculated as a rolling 28-day average, is the gold standard for understanding a player’s prepared state. A well-managed chronic workload can also protect against injury.
In the MLS NEXT Academy setting, roster changes, schedule volatility, and age group transitions make a strict 28-day window difficult to maintain. A practical minimum of 21 days is appropriate for establishing a new chronic baseline: 21 days’ worth of data is enough to generate a reliable reading without waiting so long that the information becomes operationally useless. The key metrics to track across that window are total distance, high-speed running distance, sprint distance, sprint count, maximum velocity, and acceleration and deceleration counts.
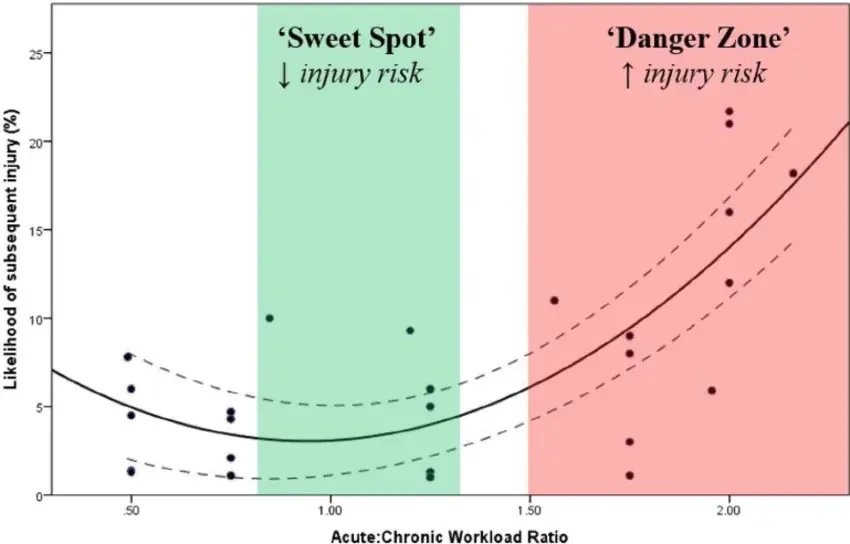
While the acute-to-chronic workload ratio is widely referenced in sport science, researchers have significantly challenged its use as a standalone injury prediction tool. Impellizzeri et al. (2020) found that the statistical properties of the ratio make it an inaccurate metric that complicates practical interpretation and concluded that no reliable evidence supports its use as the basis for training load management decisions aimed at reducing injury risk.
Rather than relying solely on a ratio, practitioners serve themselves better by monitoring absolute trends over time, especially spikes in HSR volume and velocity across consecutive sessions and weeks. Sudden week-to-week increases in HSR distance, sprint frequency, or acceleration and deceleration counts are more actionable than a ratio that low chronic load values, missing data, or fixture congestion can distort.
Return-to-Play Players
For players coming back from injury, baseline data takes on even greater importance. The goal of any return-to-play program is to prepare the player to meet the most intense demands of match play, and you cannot do that without knowing what their own demands looked like before the injury occurred.
Start by reviewing the player’s pre-injury GPS history and reverse-engineering the physical profile of their typical match and training load. As players progress through their return-to-play stages, track volume metrics, including total HSR, SD, acceleration and deceleration counts, and intensity metrics, including HSR, sprint distance, and acceleration and deceleration efforts per minute. A player can hit volume targets while still being underprepared if the intensity of their work has not been progressively restored.
New Signings
New signings require a different kind of baseline management, one built around integration, not just measurement. Before a new player steps into a full training week, the coaching staff needs to understand their recent history: how many days per week they trained at their previous club, what level they came from, and what their typical weekly load looked like.
A player arriving from a lower-tier environment who trained twice a week should never be immediately absorbed into a four-day build. That would double their workload in the first week and create a significant soft tissue injury risk. Gabbett (2016) demonstrated that limiting week-to-week load increases to less than 10% keeps injury likelihood low, and that rapid spikes in acute load are among the strongest predictors of non-contact soft tissue injury.
Applied practically, a sound integration strategy is to reduce the new player’s load by approximately 20-25% relative to the group for the first two weeks, giving them a structured acclimation period before they are held to the same benchmarks as established squad members. This keeps their workload progression in a safe range while their baseline is being established in their new environment.
A Note on RPE
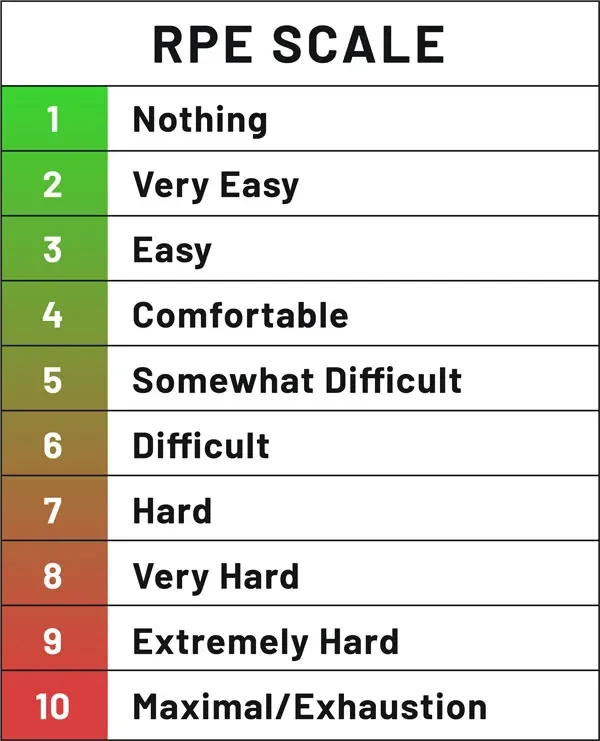
RPE (rating of perceived exertion) can be a valuable complement to GPS data throughout the season. PlayerData EDGE includes an RPE survey feature that allows players to self-report how demanding each session felt, helping practitioners gauge whether planned intensities are landing as intended. However, RPE is not a plug-and-play tool. Its value depends entirely on player education. If players do not understand what each point on the scale represents, the data they return will be inconsistent and potentially misleading. Walk players through concrete examples of what a 3 feels like versus a 7, and reinforce that the rating reflects physical exertion, not mood or motivation. If that foundation is not in place or buy-in is not there, use RPE intentionally or do not use it at all. There is no value in collecting data you cannot trust.
Communicating with the Coaching Staff Before You Present Any Numbers
Technology is never the hard part. The people are.
You can have the most sophisticated GPS system on the market, clean baselines for every player, and a perfectly structured daily report and still have the data misused in the first 10 minutes of a staff meeting. I learned this firsthand when a coach pulled up a session report, pointed to the player with the lowest total distance on the day, and said flatly: “This player didn’t do anything. That needs to be addressed.”
It was a reasonable reaction to a number presented without context. What the number did not show was that the player had missed a significant portion of the session due to an excused absence. When we looked at their output relative to the time they were on the pitch, their metrics were well within their normal range. The trend was not concerning. The raw number was just incomplete.
That moment taught me something I have carried into every staff interaction since: a number on a slide is not insight. Insight is the number plus the context that tells you what it means.
Framing the Conversation
Before presenting any data to coaching staff, establish one ground rule: metrics require context to be actionable. Total distance is the number coaches gravitate toward most naturally because it is the most intuitive, but total distance alone can be deeply misleading. A player who covered less ground than their teammates may have been managing a minor physical complaint, may have played a more positionally restricted role in that session, or may simply have been absent for part of the activity. None of that shows up in the raw number.
Your job as a practitioner is not just to deliver the data but also to deliver the interpretation. When you send a report or walk into a debrief, lead with the finding, not the figure. Instead of presenting a table and letting coaches draw their own conclusions, front-load the narrative: “One player was flagged this week. Let’s discuss why the player was flagged, some strategies we can implement, and my personal recommendations for moving forward.”
Daily reports also help you confirm when players are meeting the physical objectives. That matters. If you only approach coaches when there is a problem, the relationship can become difficult. Report the good and the bad with equal consistency. Trust is built in both directions.
Building a Collaborative Culture
The most effective GPS programs are not ones where the sport scientist presents findings and the coaches react to them. They are ones where practitioners and coaches have built a shared language around the data and make decisions together. Make it clear from the outset that the data is not there to evaluate coaches or second-guess their decisions. It is a tool for everyone on staff to use collectively in the best interest of the players. When coaches feel ownership over the information rather than scrutiny from it, they engage more honestly and more productively.
In practice, this looks like regular collaborative check-ins where the data is reviewed together rather than handed down. The practitioner brings the data and the interpretation. The coaches bring the tactical and personal context that GPS cannot capture. Flagging a player is not about pointing fingers; it is about maintaining their health, safety, and performance so the squad arrives at each match in the best possible physical condition. When that shared purpose is understood by everyone on staff, the data stops being a source of tension and starts being a genuine competitive advantage.
Building Trust Over Time
Trust with coaching staff is built through consistency, simplicity, and frequency. From my own experience, the most effective reporting cadence was daily. Rather than waiting for a weekly summary to surface a problem that may have been building across several sessions, daily reports kept the coaching staff informed in real time and made the data feel like a living part of the training process rather than a periodic audit.
The structure of those daily reports focused on the team first. A group-level overview gave coaches an immediate read on how the squad tracked against their benchmarks for TD, HSR, SD, and any notable intensity spikes. That team picture was the starting point for every conversation.
When an individual player needed attention, I handled that conversation separately and directly. Rather than highlighting a flagged player in a group report where coaches could misread or take the information out of context, I went to the head coach individually, flagged the player, and started with a simple conversation. I avoided alarmist language and overloaded data. Instead, I provided a clear, collaborative check-in to make sure everyone was on the same page and that the player’s needs were being looked after.
That combination of transparent daily reporting at the team level and quiet, direct communication at the individual level built the kind of trust where coaches started asking questions before problems became visible. That is the standard worth aiming for.
Beyond Total Distance: The Metrics That Actually Matter
Total Distance vs. High-Speed Running Distance
Most coaches gravitate toward total distance as the primary indicator of whether a session reflected meaningful work. Total distance is the most intuitive metric and the easiest to communicate, but it is also the most incomplete. Viewing total distance as the sole measure of session quality means missing the picture entirely. As practitioners, our job is to dig deeper and guide coaching staff toward a more complete understanding of training intensity, and that starts with high-speed running thresholds.
In an academy setting where players are on the pro-player pathway, setting velocity thresholds to match senior-level standards is appropriate. It gives you the most accurate comparison of a player’s readiness to perform at the highest level. The current thresholds most clubs use for male players are 5.5 m/s for Zone 5 (high-speed running) and 7.0 m/s and above for Zone 6 (sprinting).
With those thresholds in mind, compare two players side by side from the same session who have completely different HSR readings.
Player A completed the MD-3 session in 75 minutes with 6,400 meters of total distance and 100 meters of total HSR distance.
Player B, on the other hand, completed the MD-3 session with 6,100 meters of total distance and 400 meters of total HSR distance.
Coaches who miss the HSR readings will also miss how much harder Player B’s session was compared with Player A’s. Yes, Player A completed 300 more meters of total distance, but HSR intensity explains why Player B experienced a much more intense session. Player B completed four times more high-speed running distance than Player A, 400 meters versus 100 meters.
To calculate intensity, divide the number of meters covered by the number of minutes in the session.
Total Distance Speed Comparison (m/min)
That is not a significant difference. A 4.00 m/min gap in overall running speed across a match is relatively minor. Both players are operating at very similar intensities. The 300-meter total distance gap is modest over a full match.
High-Speed Running Distance Comparison (m/min)
Yes, this is a very significant difference. Player B covered four times more high-speed running distance than Player A (400 m vs. 100 m). This is a substantial gap and suggests several possibilities:
Player B was far more active in high-intensity sprinting and running phases.
Player A may have been more conservative, fatigued, or played a less demanding positional role.
HSR is often a key performance indicator in match analysis, making this disparity meaningful.
Summary
Zonal Analysis: Individual vs. Team Averages
Core Philosophy
The most common mistake in GPS-based load management is measuring a player against the wrong standard. Team averages tell you how a player compares to the group; they do not tell you whether that player is operating within their own healthy range. PlayerData EDGE addresses this directly through zonal analysis that compares each player’s current output against their own rolling weekly averages, making the data personal, contextual, and actionable.
The Key Trigger Scenario
When a player hits 90% or more of their weekly HSR average in a single session, that is a signal worth paying attention to. It does not automatically mean something is wrong, but it does mean the conversation needs to happen before the next session. The GPS data alone cannot tell you whether that load is a problem. Only the conversation can.
What a 90%+ Weekly HSR Session Should Trigger
Outcome Scenarios
The conversation is where the decision gets made. What the player tells you about fatigue, soreness, sleep, and how the session felt determines which direction you go. The table below maps the most common combinations of GPS output and RPE response to their appropriate outcomes. Use it as a decision framework, not a mechanical checklist.
GPS and RPE Decision Framework
The Coach Conversation: Key Questions
Knowing what to ask is as important as knowing when to ask it. The questions below surface the information GPS cannot capture: fatigue not yet showing in the data, external stressors affecting recovery, and the player’s own sense of readiness. Listen for hesitation as much as the answers. A player who pauses before saying they feel fine is telling you something.
Coach Conversation Questions
Modification Options
Once the conversation gives you the context you need, the modification decision follows a tiered structure built around one principle: the response should match the signal. A player showing minor fatigue after a high-load session does not need a full rest day. A player masking significant fatigue with a flat RPE score does.
Modification Options
Core Principle
The GPS flags it. The RPE contextualizes it. The conversation decides it. Each layer adds depth, and the coach’s ability to read the player in that conversation is what turns data into genuinely individualized load management.
Acceleration and Deceleration Load
Total distance tells you how far a player ran. High-speed running tells you how fast they ran. Neither tells you how hard their muscles and connective tissue were working. That is where acceleration and deceleration load becomes indispensable.
Every time a player accelerates, their muscles generate significant concentric force to produce speed. Every time they decelerate, those same muscles, particularly the hamstrings and quadriceps, absorb force eccentrically to slow the body down. Research has shown that decelerations impose considerably greater mechanical stress on soft tissue than any other kinematic variable, accounting for up to 65% more impact on physical load than other movement metrics and up to 37% more than accelerations themselves (Harper & Kiely, 2018). This is not a minor distinction. A player can finish a session with modest total distance and low high-speed running output and still have accumulated a substantial mechanical load through repeated acceleration and deceleration efforts. If you are not tracking accel/decel counts, you are missing a primary driver of soft-tissue injury risk.
The biomechanical case is well established. Accelerations place high metabolic and concentric demands on muscle tissue, while decelerations generate eccentric loading that is directly associated with muscle damage and fatigue accumulation (Harper et al., 2019). In soccer specifically, the frequency of very high-intensity decelerations exceeds that of accelerations, making soccer a deceleration-dominant sport where the braking demands of match play carry injury implications (Nedergaard et al., 2017). Researchers have also documented a second-half decline in high-intensity acceleration and deceleration frequency in elite match play, suggesting these actions are especially sensitive to fatigue development and serve as a reliable early signal of neuromuscular fatigue (Nedergaard et al., 2017).
In terms of how I weigh this metric within the overall load picture, acceleration and deceleration counts sit alongside high-speed running distance, sprint distance, and total distance as equally important pieces of the puzzle. There is no hierarchy. Each metric tells a different part of the story, and the full picture only emerges when you read all of them together. A session with low total distance, modest HSR, and a high accel/decel count can represent a physically demanding session that a surface-level reading would completely miss.
The reason accelerations and decelerations remain underappreciated at most programs is straightforward: explaining them is harder than explaining total distance. Coaches intuitively understand that running 10 kilometers is significant. Explaining that 45 high-intensity decelerations represent a meaningful eccentric load on the hamstrings requires a different kind of conversation. That conversation is worth having. As practitioners, part of our role is to build the coaching staff’s literacy around the metrics that drive injury risk, and acceleration and deceleration load is near the top of that list.
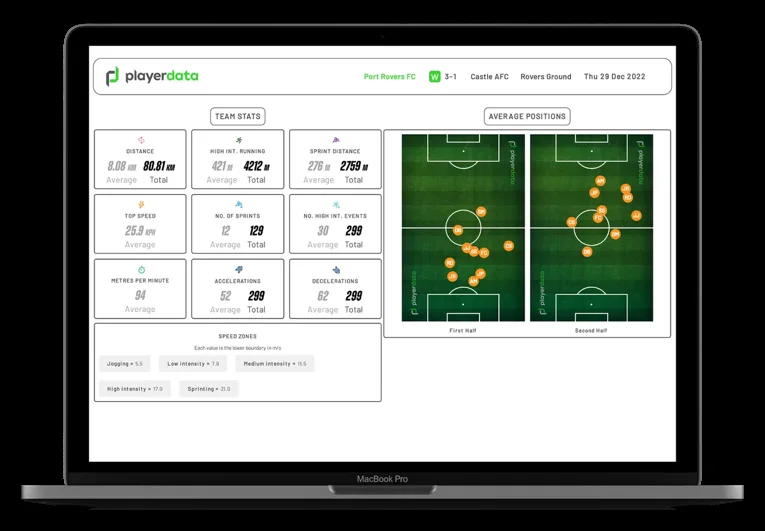
The Load Management Dashboard
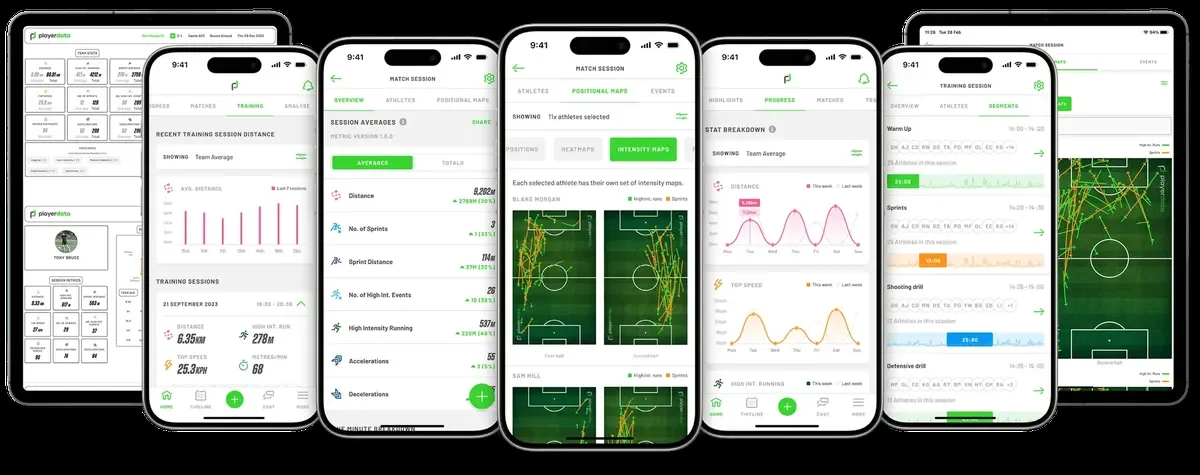
The PlayerData dashboard is structured to give coaches immediate access to the most critical information. On the front page, the focus is on the key performance indicators that tell the full story of a player’s output: total distance, high-speed run volumes, total intensity measured in meters per minute, high-speed run distance, acceleration, deceleration, and sprint distance. Whether built internally or uploaded into an athlete management system, the goal of the front page is to present the entire picture clearly and efficiently, both at the individual level and in the context of the wider team comparison. Coaches should never work from incomplete information. If outliers exist in the data, the front page surfaces them immediately so coaches can see findings that may require a modification to the player’s loading plan.
One click deeper, the dashboard moves into a more granular layer of analysis. This is where the weekly load distribution lives and where individual trends can be tracked over time. The acute-to-chronic ratio is presented in a way that coaches can interpret easily without needing a deep analytical background, using clear visual cues to communicate where each player sits.
Color coding serves as the primary flag system: green indicates the player is within a safe and well-managed range, amber signals that the player is approaching a threshold that warrants attention, and red indicates that the load has exceeded a safe window and the staff likely needs to intervene.
Trend arrows accompany the color coding to show the direction the data is moving, giving coaches the context of whether a player is trending toward risk or recovering back into a healthy range. The system includes built-in threshold alerts so that nothing significant goes unnoticed. When a player’s data crosses a meaningful boundary, the alert prompts the coaching staff to act, whether that means initiating a conversation, making a session modification, or giving the athlete a day off to recover.
Building Individual Loading Blueprints
What Is an Individual Loading Blueprint?
An individual loading blueprint is a personalized high-intensity output profile built specifically for each player. It is designed to maintain performance while keeping the player injury-resilient over the course of a season. Rather than applying a one-size-fits-all approach, the blueprint is constructed by looking at all key metrics collectively: total distance, high-speed running, accelerations, decelerations, and sprint distance, contextualized against the player’s position, age, training age, and injury history. The goal is to establish a clear picture of what that individual player needs, what they can tolerate, and where their thresholds lie, so that every loading decision made around them is informed, intentional, and specific to who they are as an athlete. This stands in direct contrast to a generic weekly plan that applies identical targets to every player regardless of position, physical history, or individual tolerance.
How You Build One
Building an individual loading blueprint begins with the same inputs established earlier: historical GPS data, position-specific demands, age, training age, and any flagged injury history or medical findings. But the process of bringing those inputs together looks very different depending on who the player is. The blueprint is where all of that context becomes operational.
Age and Recovery Tolerance
Age is one of the most consequential variables in the blueprint-building process and one of the most consistently underweighted in generic weekly plans. Research has demonstrated that professional soccer players age 30 and older show significant reductions in total distance, high-speed running distance, sprint distance, and the number of accelerations and decelerations compared to their younger counterparts (Rey et al., 2019; García-Calvo et al., 2023). These are not marginal differences. They represent a fundamentally different physical profile that requires a fundamentally different loading approach.
A 22-year-old wide midfielder and a 33-year-old central defender do not just play different positions. They recover differently, tolerate high-intensity work differently, and respond to loading spikes differently. The younger player generally has greater capacity to absorb and recover from high-intensity output across a congested week. The older player may need extended recovery windows between high-intensity sessions, reduced sprint and acceleration volume in the days following a match, and closer monitoring of fatigue signals that may not surface immediately in the GPS data.
Position-Specific Demands
As established in the section on total distance versus high-speed running, the physical demands of a wide midfielder and a central defender are not comparable. The wide midfielder operates in a high-speed running and sprint-dominant profile, so their blueprint targets will reflect elevated HSR distance, higher sprint counts, and frequent acceleration and deceleration efforts across the width of the pitch. The central defender’s profile is lower in total distance and high-speed running output, with a greater emphasis on short accelerative efforts and positional deceleration demands within a more compact zone of operation (Baptista et al., 2019; CIES Football Observatory, 2022).
When you overlay age onto position, the blueprint becomes even more specific. A 33-year-old central defender is not just operating in a lower-intensity positional profile; they are doing so with a reduced physiological ceiling and a slower recovery curve. Their blueprint will carry tighter upper boundaries on weekly HSR accumulation, more conservative load progression following a congested fixture period, and a longer baseline window before any threshold adjustments are made.
Blueprints as Living Documents
A loading blueprint is not a one-time plan. It is a living document that gets revised as the player’s data, health status, and season context evolve. Key triggers for review include a new injury or return-to-play progression, a position change, a sustained period of high load accumulation without adequate recovery, or a player consistently performing well below their targets across multiple weeks.
Review blueprints at minimum monthly during the season, with additional unscheduled reviews triggered by any of the above. The goal is not to rewrite the blueprint constantly; it is to ensure the targets still reflect the reality of who that player is and what they can handle at any given point in the season.
Case Study: A Loading Blueprint in Action
The most instructive cases are rarely the ones that go perfectly. This one did not, and the lesson it produced shaped how I approach return-to-play planning to this day.
The Situation
A player at an MLS NEXT Academy club sustained a grade 1 hamstring strain, a soft-tissue injury with a projected return-to-play timeline of two to four weeks. The injury itself was not random. Looking back at the data, the cause was clear: the squad had taken a full week off training due to inclement weather, and when we returned to the pitch, we were not conservative enough in how we rebuilt the session intensity. The result was a significant spike in high-speed running volume on the first day back, the exact scenario the literature warns against, and the player pulled up with a hamstring strain shortly after.
The mistake was mine. The week off had effectively reset the player’s chronic workload, and we treated the return session as if that baseline was still intact. It was not. I did not catch the spike in high-speed running volume in time, and that is a failure of individual monitoring, not system capability. The PlayerData EDGE individual dashboard exists precisely to prevent this kind of oversight. The dashboard allows practitioners to review each player’s HSR volume, acceleration counts, and deceleration counts after every session at the individual level, rather than relying on group averages that can mask exactly the kind of spike that caused this injury. Had I been more diligent in reviewing each player’s individual dashboard that week, the spike would have been visible before the session that caused the injury, not after. That error informed everything that followed.
Building the Return-to-Play Blueprint
The first step was going back through the player’s historical GPS data to reconstruct their performance norms. Match-day data was the primary reference point: high-speed running distance, acceleration and deceleration volumes, sprint distance, total distance, and session intensities measured in meters per minute. These numbers formed the target profile the player needed to return to before receiving clearance for full training and match availability.
We structured the return-to-play process in two distinct phases. The first phase focused on return-to-run protocols. The objective was to progressively restore the player’s ability to accelerate, decelerate, and sprint without restriction or compensation. We completed this phase in collaboration with the medical staff, and the player did not advance until they demonstrated full mechanical competency across those movement patterns.
The second phase was where the loading blueprint became the primary tool.
We built the volume targets for this phase around the player’s own match-day demands for their specific position. We benchmarked acceleration and deceleration counts, high-speed running distance, and sprint distance against what that individual player typically produces across a full 90-minute match, not a generic positional norm. Alongside those volume targets, the session intensities matched the player’s own match-day intensity profile, ensuring that the physiological demand of the return-to-play sessions reflected the true stress of competitive match play for that specific individual.
The session window for this phase was 45 to 60 minutes. Full match total distance was not the target. Replicating that would require 90 minutes of play and was neither practical nor appropriate at this stage of the return. The priority was matching the right intensities and the right high-intensity volumes within the available time, so that when the player returned to full training, their soft tissue and neuromuscular systems had already been prepared for the demands they would face. In practice, we delivered phase two across three structured sessions, each with a distinct emphasis, building progressively toward full clearance.
The Clearance Standard
Clearance required the player to demonstrate the ability to meet their own match-day demands across every key metric: acceleration and deceleration volumes, sprint distance, and high-speed running distance from a total-volume perspective, as well as intensity benchmarks of meters per minute, HSR per minute, and acceleration and deceleration efforts per minute. Every target was specific to that individual player’s position demands and historical match-day data, not a generic standard. We delivered this across three sessions over one week, each with a distinct emphasis building progressively toward full clearance.
Session 1: High-Speed Running and Sprint Emphasis
The first session prioritized HSR and sprint distance, targeting the player’s match-day demands for both volumes and intensities. For a fullback, drills included 20-to-30-meter sprint efforts with a cross into the box followed by a recovery sprint to halfway, replicating the specific actions they would perform in a match.
Session 2: Acceleration and Deceleration Emphasis
The second session shifted focus to acceleration and deceleration demands, targeting match-day totals for both volume and intensity to ensure the player’s neuromuscular system was adequately prepared for the repeated braking and accelerative efforts their position requires.
Session 3: Top Speed and Full Integration
The third session was the most sport-specific of the three. Two to three bouts of flying tens served as the primary tool for reaching top-end velocity. Players also performed position-specific actions such as shooting and change-of-direction efforts, demonstrating the ability to execute without restriction or adverse reaction before the medical and performance staff jointly granted clearance.
What Worked and What We Would Do Differently
The phased structure worked. Moving through return-to-run protocols before introducing match-intensity demands gave the player’s soft tissue time to adapt progressively. Using intensity metrics rather than volume metrics as the primary benchmark for phase two was the right call. It allowed us to replicate the physiological demands of match play without requiring full match distances before the player was physically ready.
What we would do differently is straightforward. I did not catch the HSR spike in time, and I was not adamant enough in communicating the need for a conservative return to the coaching staff. Advocating for conservative re-entry after any significant training disruption is not optional. It is part of the job, and the coaching staff needs to hear that recommendation clearly before the session plan is set.
That experience reinforced a standard I now apply consistently: after any significant break in training, build a mandatory conservative re-entry protocol into the team plan before it is needed, not after an injury has occurred. A pre-planned reduction of 20% to 25% in high-speed running and sprint volume on the first session back would have been the appropriate response to a disrupted chronic baseline. That protocol is now standard, and the individual dashboard review is now a non-negotiable part of the daily reporting process.
Closing the Communication Loop
Present data to all key stakeholders as quickly as possible following a session. The format should be clean, consolidated, and digestible: everything on one page, covering the key metrics for that audience, delivered in a single email chain that includes medical staff, coaching staff, strength and conditioning, and any other relevant stakeholders. That shared chain keeps everyone working from the same information at the same time, eliminates silos, and creates a unified starting point for decisions.
The weekly rhythm follows a consistent cadence. Daily reports go out immediately after each training session, giving coaching and medical staff a real-time read on how the squad is tracking. At the end of the week, once the match has concluded, the staff compiles and distributes a comprehensive weekly summary to all stakeholders. That summary captures training load across all sessions, match-day outputs, flagged individuals, and the key metrics that will inform the loading plan for the week ahead.
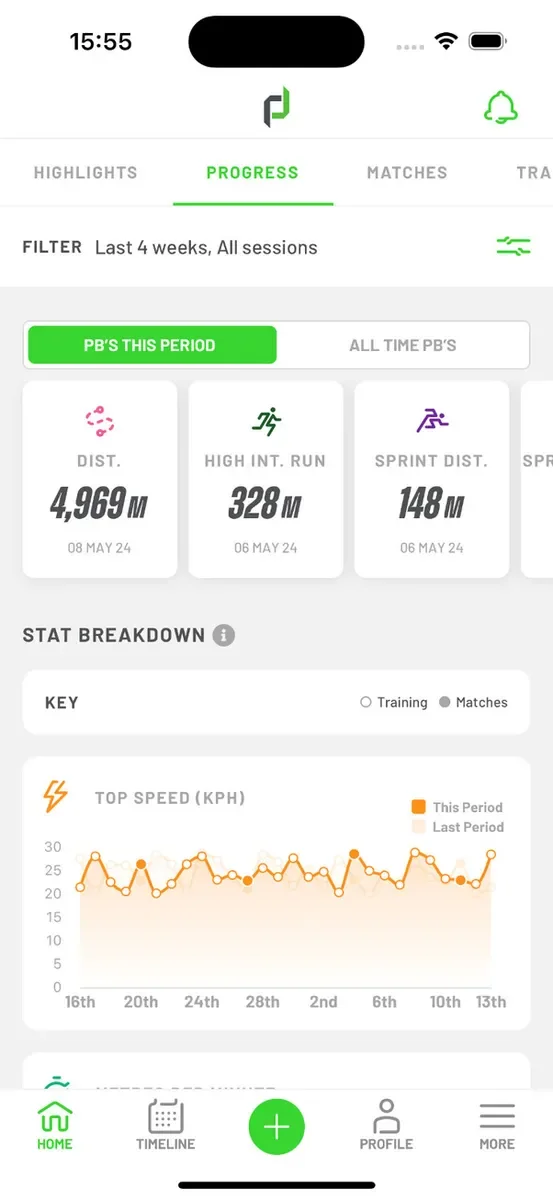
At the player level, platforms like PlayerData give each athlete access to their own metrics. From experience, this creates genuine buy-in; players develop a sense of ownership over their performance and begin to understand the direct relationship between their training load, recovery, and ability to perform. When players understand that the process is designed to enhance their performance and protect them from injury, anxiety and gaming behavior are far less likely to become issues.
When individual cases require deeper strategic planning, separate conversations between sports science and medical staff become necessary alongside the unified email chain. If the data flags a player as an outlier, that is the moment for a focused conversation to discuss modifications and build an individualized plan.
The process becomes politically complex when the data points clearly in one direction and the head coach wants to go in another. The role of the sports scientist is to remain objective, present the data for exactly what it is, and clearly communicate the implications of exceeding a flagged threshold. The goal is not to override the coach. The goal is to ensure the club is never in a position where the risk was known and not communicated. At the end of the day, every stakeholder is working toward the same goal: keeping players healthy, available, and performing at the highest level possible.
Common Mistakes Practitioners Make with GPS Data
One of the most common mistakes practitioners make with GPS data is leaning too heavily on a single metric, and that metric is almost always total distance. The reason is understandable: total distance is easy to communicate, easy to visualize, and universally understood by coaches and stakeholders. But when total distance becomes the headline and everything else gets left behind, the practitioner fails to tell the full story. High-speed running, accelerations, decelerations, and overall session intensity are all critical pieces of the picture, and without them the data is incomplete. The conversation around load becomes surface-level, and the opportunity to make genuinely informed decisions gets lost.
Comparing players against team averages rather than their own individual baselines is another significant pitfall. Every player carries a different capacity, a different history, and a different tolerance to high-intensity work. When a spike in an individual’s data gets masked by a team average, it can go unnoticed until it becomes a problem. The baseline must be personal. Injury risk is personal.
Equally damaging is the misuse of GPS as a surveillance tool rather than a coaching tool. A real example of how this plays out in practice: a sport coach takes session data, approaches a player directly, and says plainly that their numbers are not good enough and they need to do more work. That interaction, however well-intentioned, creates resentment. The player does not feel valued. They feel monitored and judged. In the specific situation this reflects, critical context was missing: the player had traveled two hours to training and arrived late, missing the first 10 minutes of the session. The lower output had a straightforward explanation that the raw number never showed. Soft skills matter as much as data literacy in these moments. Understanding the context before approaching a situation too forcefully is not just good practice. It is essential to maintaining the trust and relationships that make the entire system function. When players feel that staff are using the data against them rather than for them, compliance suffers, buy-in disappears, and the system breaks down entirely.
The solution to this problem is not less transparency; it is better-structured transparency. Giving players access to their own data in a format that is personal, contextual, and free from unhealthy peer comparison creates the kind of environment where GPS works as a development tool rather than a monitoring system.
This is also why PlayerData designed the individual dashboard so that players can see their own metrics without seeing how they rank against their teammates. That privacy is intentional and valuable. It protects players from unhealthy comparisons while still giving them ownership over their own performance data. The dashboard is also an opportunity to reinforce an important message: the player who covered the most distance or produced the highest outputs in a session is not automatically the best soccer player on the pitch. Research has shown that more aerobically efficient players demonstrate more stable energy utilization during matches, and that successful teams with higher ball possession often cover less total distance than their opponents (Bradley & Ade, 2018). The point is to use physical output to perform soccer actions well; the physical metrics are in service of the sport, not the other way around. Keep the main thing the main thing.
Presenting data without context is another mistake that leads coaches to draw the wrong conclusions. Frame every finding carefully, highlight outliers clearly, and communicate the story with intention. A number without context is not insight; it is noise.
Perhaps the most quietly damaging mistake of all is failing to close the loop. Collecting rich, detailed data and never allowing that data to change a decision renders the entire system pointless. GPS data is only as valuable as the actions it produces. The difference between having GPS because everyone else has it and using GPS as a genuine performance and injury mitigation tool comes down to whether the data consistently drives meaningful decisions, because that is the entire point of collecting it in the first place.
Getting Started: A Practical Guide for Programs New to GPS
For programs just getting started with GPS tracking, the temptation is often to monitor everything at once. The most effective approach in the first season is to narrow the focus to the metrics that will tell you the most. High-speed running, accelerations, decelerations, and sprint distance in relation to total distance are the metrics worth prioritizing from the start. Together they capture not just how far players are running but how intensely they are doing it, giving you a meaningful window into session demands and how they compare to MD-4, MD-3, and MD-2.
The minimum viable workflow is straightforward: collect daily, review daily, and report daily. According to PlayerData’s own product documentation, setup takes less than 30 seconds, and the entire squad’s data can be wirelessly downloaded to any device in under three minutes (PlayerData, 2024). From personal experience in an MLS NEXT Academy setting, PlayerData created a Google Drive integration where session data uploaded via CSV files could be imported directly into an athlete management system in approximately two to five minutes. For programs relying solely on the PlayerData platform, the download takes a couple of minutes, the upload is near-immediate, and the system automatically generates a report sent directly to the connected account email within one to two minutes.
A practitioner should expect to commit approximately one to two hours per week to running the tracking process well: download and upload takes two to five minutes per session, data review and individual player checks take 10 to 15 minutes, report preparation takes another 10 to 15 minutes, and stakeholder conversations add 15 to 20 minutes depending on findings. That is a highly efficient time investment. Clean, consistently reported data saves significantly more hours throughout the week by eliminating lengthy staff debates, reducing guesswork around loading decisions, and giving coaches and medical staff the information they need to act quickly. The system pays for itself in time long before it pays for itself financially.
For any program director weighing the investment, evaluate the system not just on what the data produces but on how much time the workflow saves across the staff. GPS technology is no longer reserved for professional environments; it is accessible and genuinely impactful at the college, academy, and high school level when implemented with the right focus and workflow from the start.
The Data Is Only as Good as the Decisions It Drives
Think back to the opening scenario: an MD-3 session where the group averages looked fine, every benchmark appeared met, and the session looked like a success on paper. It was not. Underneath those averages were individuals who had blown past their thresholds and others who had not come close to meeting the day’s objectives. The data was there. The decision was not. That is the gap this guide has been built to close.
GPS tracking is not about the data itself. It is about the decisions the data empowers you to make. The metrics exist to serve the blueprint, and the blueprint exists to protect the player. When you communicate those pieces clearly across the right stakeholders and integrate them into each player’s individual loading plan, the system works the way it is supposed to: keeping players available, healthy, and performing at the level the team needs them to. The goal is not more tracking. It is smarter tracking tied to a clear communication workflow, grounded in individual baselines, and always connected back to the objectives set for that specific session and that specific player.
So here is the challenge. Look at your data this week, start with high-speed running, and ask whether every individual met the objectives set for the day. If someone exceeds their threshold, act on it. If someone fell short, find out why. The data will never make the decision for you, but it will always give you the information you need to make the right one. In this field, letting good data sit without a response is the one mistake you cannot afford to make.
References
Baptista, I., Johansen, D., Seabra, A., & Pettersen, S.A. (2019). Position specific player load during match-play in a professional football club. PLOS ONE, 14(5), e0216282.
Bradley, P.S., & Ade, J.D. (2018). Are current physical match performance metrics in elite soccer fit for purpose or is the adoption of an integrated approach needed? International Journal of Sports Physiology and Performance, 13(5), 656-664.
CIES Football Observatory. (2022). Analysis of the distances covered in professional football. Monthly Report No. 68.
Gabbett, T.J. (2016). The training-injury prevention paradox: Should athletes be training smarter and harder? British Journal of Sports Medicine, 50(5), 273-280.
García-Calvo, T., Huertas, F., Ponce-Bordón, J.C., et al. (2023). Does player age influence match physical performance? A longitudinal four-season analysis in Spanish Soccer LaLiga. Biology of Sport, 40(3).
Harper, D.J., Carling, C., & Kiely, J. (2019). High-intensity acceleration and deceleration demands in elite team sports competitive match play: A systematic review and meta-analysis of observational studies. Sports Medicine, 49(12), 1923-1947.
Harper, D.J., & Kiely, J. (2018). Damaging nature of decelerations: Do we adequately prepare players? BMJ Open Sport & Exercise Medicine, 4, e000379. doi: 10.1136/bmjsem-2018-000379. https://bmjopensem.bmj.com/content/4/1/e000379
Hulin, B.T., Gabbett, T.J., Lawson, D.W., Caputi, P., & Sampson, J.A. (2016). “The acute:chronic workload ratio predicts injury: high chronic workload may be protective and the independent effect of acute workload.” British Journal of Sports Medicine, 50(4), 231-236.
Impellizzeri, F.M., Tenan, M.S., Kempton, T., Novak, A., & Coutts, A.J. (2020). Acute:chronic workload ratio: Conceptual issues and fundamental pitfalls. International Journal of Sports Physiology and Performance, 15(6), 907-913.
Nedergaard, N.J., Robinson, M.A., Eustace, J., Vanrenterghem, J., & Drust, B. (2017). Training load quantification in elite football: a review of current practice and future directions. Science and Medicine in Football, 1(3), 242-252.
PlayerData. (2024). Football GPS tracker. Retrieved from https://www.playerdata.com/sports/football-gps-tracker
Rey, E., Padrón-Cabo, A., Costa, P.B., & Lago-Fuentes, C. (2019). Effects of age on physical match performance in professional soccer players. Journal of Strength and Conditioning Research, 33(12), 3351-3358.
The post Beyond the Heatmap: Using PlayerData GPS to Master Load Management and Individual Performance appeared first on SimpliFaster.