From the Inside Looking Out: What Force Plate Testing Has Taught Me
By Ryan McLaughlin, BSc, MSc
Summary
Ryan McLaughlin reflects on his experiences working with force plate technology at VALD, emphasizing how real value comes from consistent retesting and actionable insights—not just amassing data. He highlights the importance of taking a simple approach and sticking to a few key metrics and using data visualization to uncover hidden performance details. Ryan stresses that data must always be interpreted within context and that simplicity and consistency in testing routines lead to the most impactful outcomes. These tools help the practitioner translate data into meaningful decisions for athlete performance and rehabilitation.
Introduction
When I joined VALD, I was stepping into a world I already knew fairly well—but I quickly realized how much more there was to learn. As a sport scientist by background, force plates, and specifically ForceDecks, weren’t new to me. But working at VALD, supporting thousands of practitioners across all levels of sport and rehab, forced me to view testing through a different lens.
Three years later, I’ve been lucky to sit at the intersection of product design, practitioner education, field research, and performance marketing. I’ve helped shape testing workflows, supported elite teams around the world, and written thousands of words about force plates—yet I still find myself refining what “good” looks like.
This article is a reflection on the lessons I’ve learned along the way—shaped by feedback from practitioners, conversations with researchers, and my own experience in the trenches.
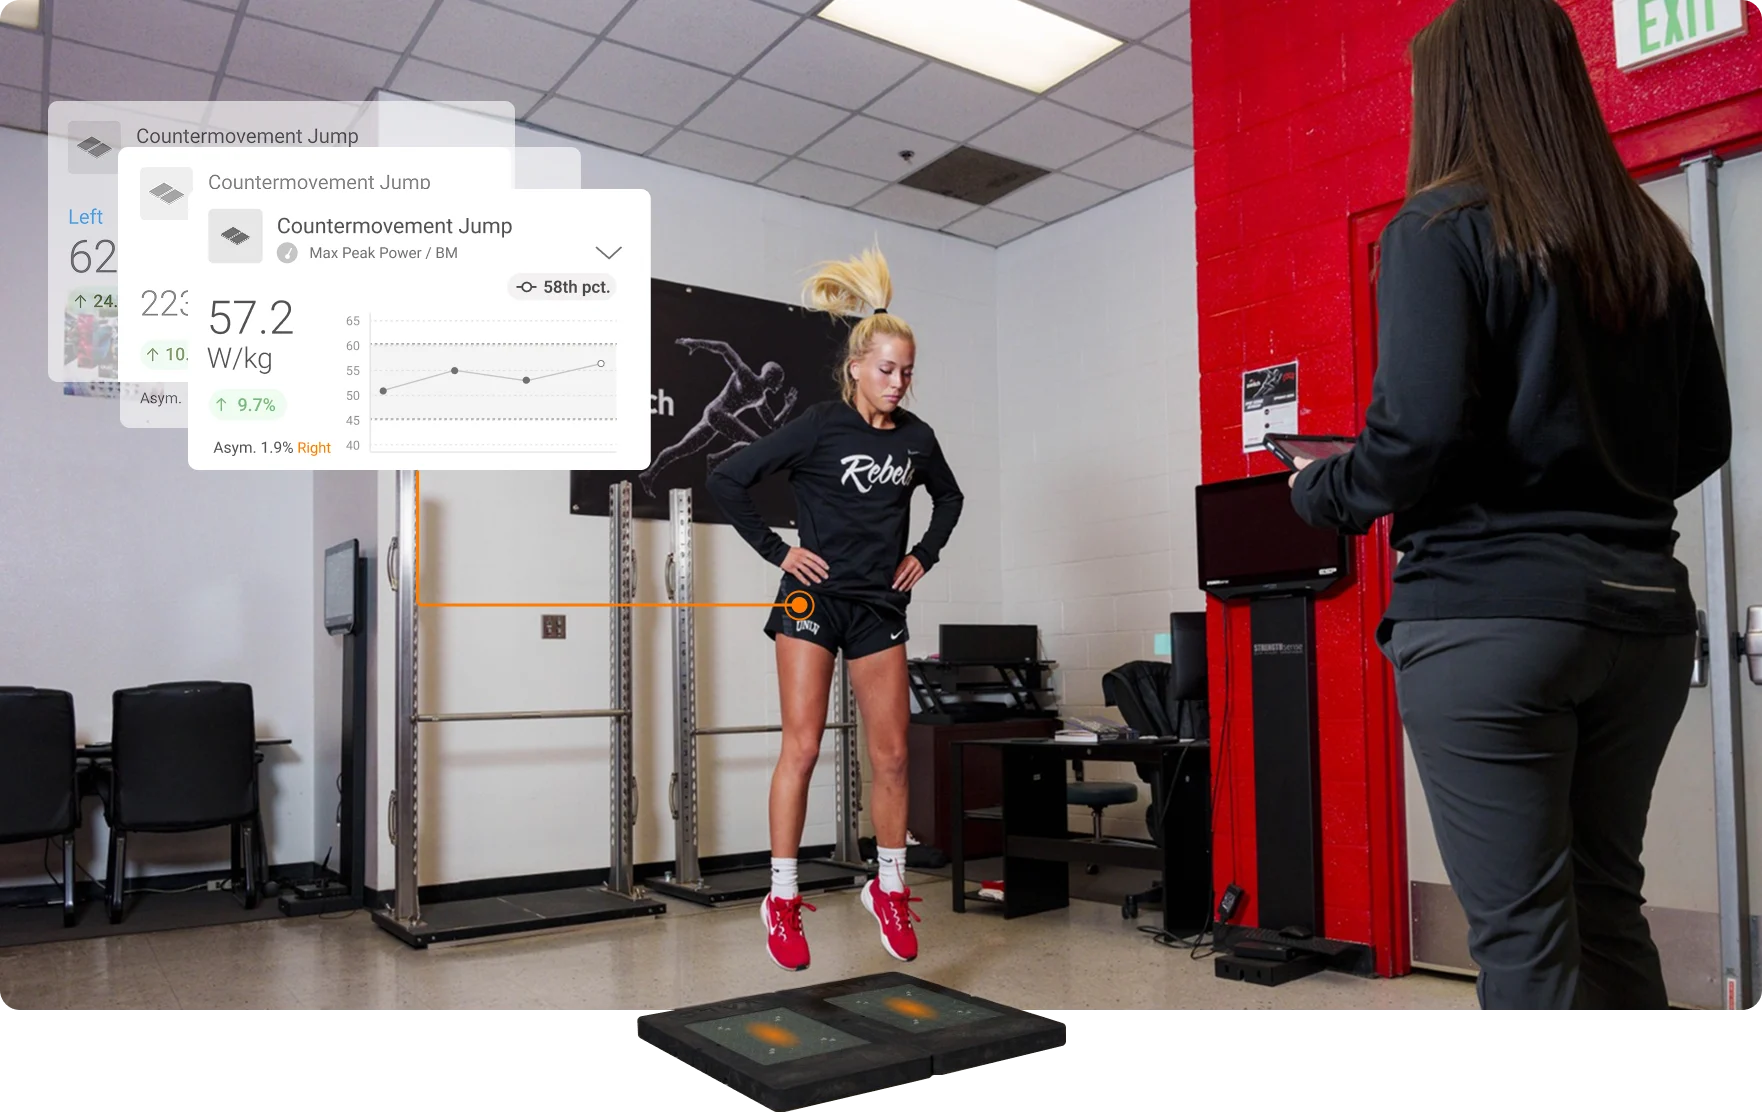
1. If You’re Not Retesting, You’re Just Collecting Data
This is a hill I’m willing to die on: the real value of force plate testing lies in tracking change—not in producing a one-off report. If you don’t plan to retest, then the time spent setting up, coaching, analyzing, and interpreting might be better used elsewhere.
Too often, I’ve seen environments treat testing like a box-ticking exercise. A jump test in week one of preseason. A report handed to the coach. Job done. But what next?
Testing should inform training. Retesting validates whether that training worked. One without the other is incomplete. Over time, I’ve started to build a simple framework around this: Test → Interpret → Intervene → Retest → Repeat
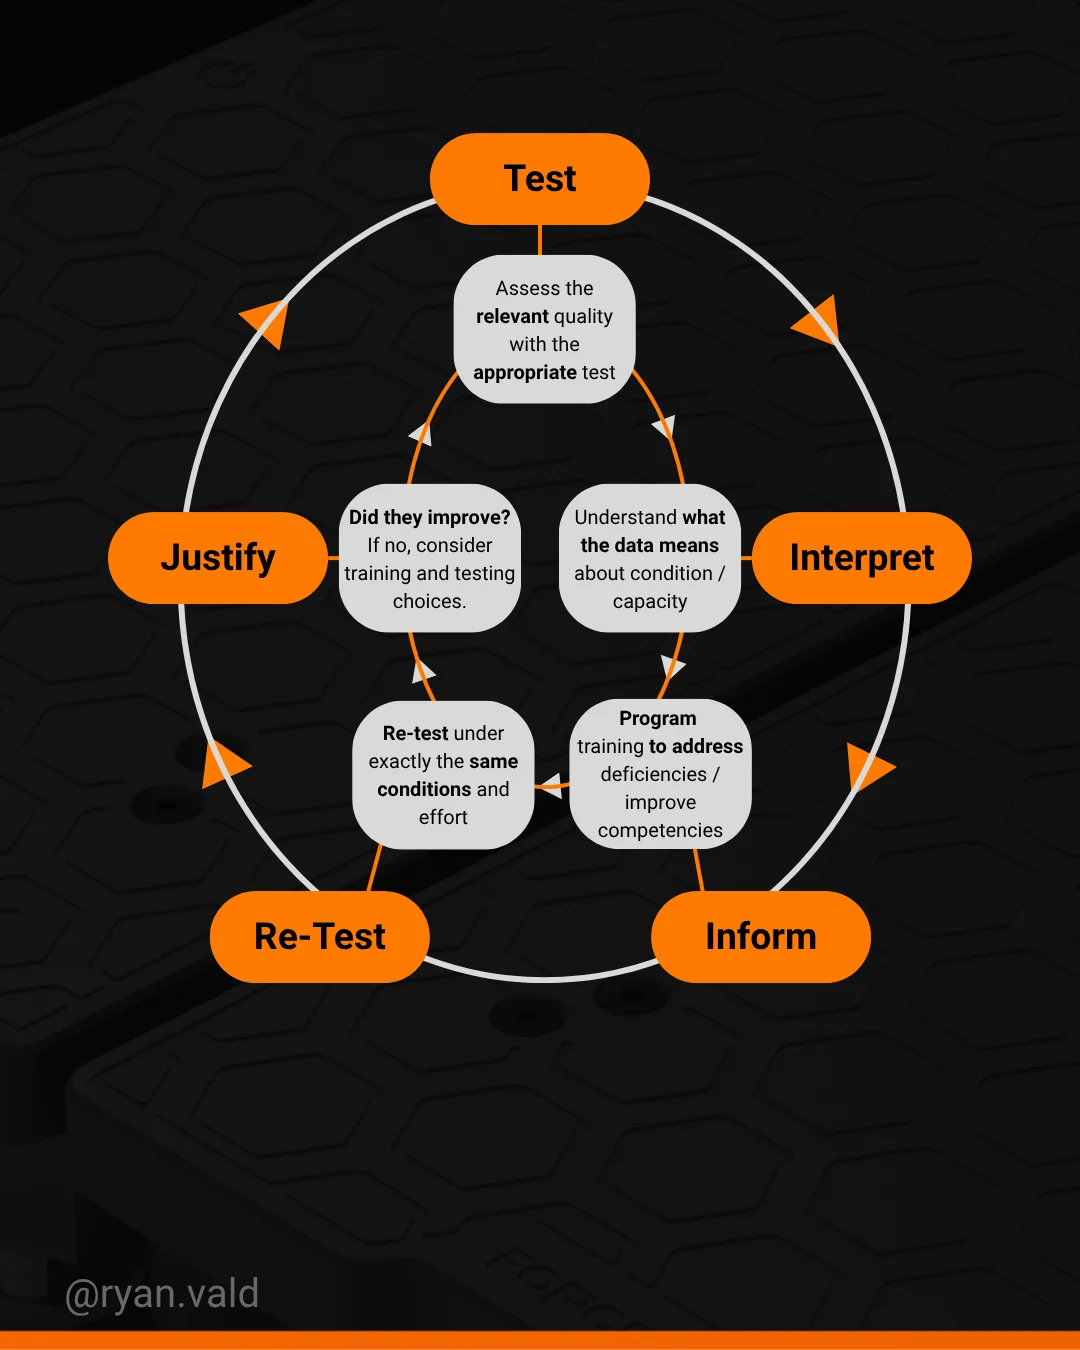
Image of the Test-Interpret-Inform-Re-test-Justify framework mentioned above
It’s not just about retesting frequency—it’s about retesting the same metrics. I’ve seen teams switch between tests, change how they calculate metrics over time or even switch the technology they’re using to assess the test, making progress almost impossible to evaluate. Pick the key metrics that matter, define how you’ll measure them, and stick with them. That’s how you build a meaningful data set. No different to programming in the gym, switching tests and metrics around too frequently is likely to leave potential adaptation benefits on the table.
2. The Best Metrics Are the Ones You Actually Use
ForceDecks generate a lot of metrics. Some are intuitive like jump height and peak power, others are more abstract like eccentric deceleration RFD or concentric impulse P1 and P2. It’s tempting to gravitate toward the latter because they feel more ‘advanced’.
What I’ve found is that the most useful metrics are the ones that create actionable conversations. In most environments, that means sticking to a few key measures that are:
- Easy to explain to athletes
- Quick to spot trends over time
- Tied to a known training quality
Jump height, contraction time, peak power/bm & eccentric deceleration phase duration are examples of just a few of my go-to metrics with jump data—they’re not glamorous, but they’re robust and reliable. When paired with context, they’re incredibly powerful.
More isn’t always better. A cluttered report doesn’t impress anyone; it confuses them. The best setups I’ve seen across multiple high performance teams typically rely on 3–5 core metrics per test—interpreted consistently over time. They’ve built a language around those values so that when they move up or down, everyone knows what it means.
[bctt tweet=”More isn’t always better. A cluttered report doesn’t impress anyone; it confuses them. The best setups I’ve seen across multiple high performance teams typically rely on 3–5 core metrics per test—interpreted consistently over time, says Ryan McLaughlin”]
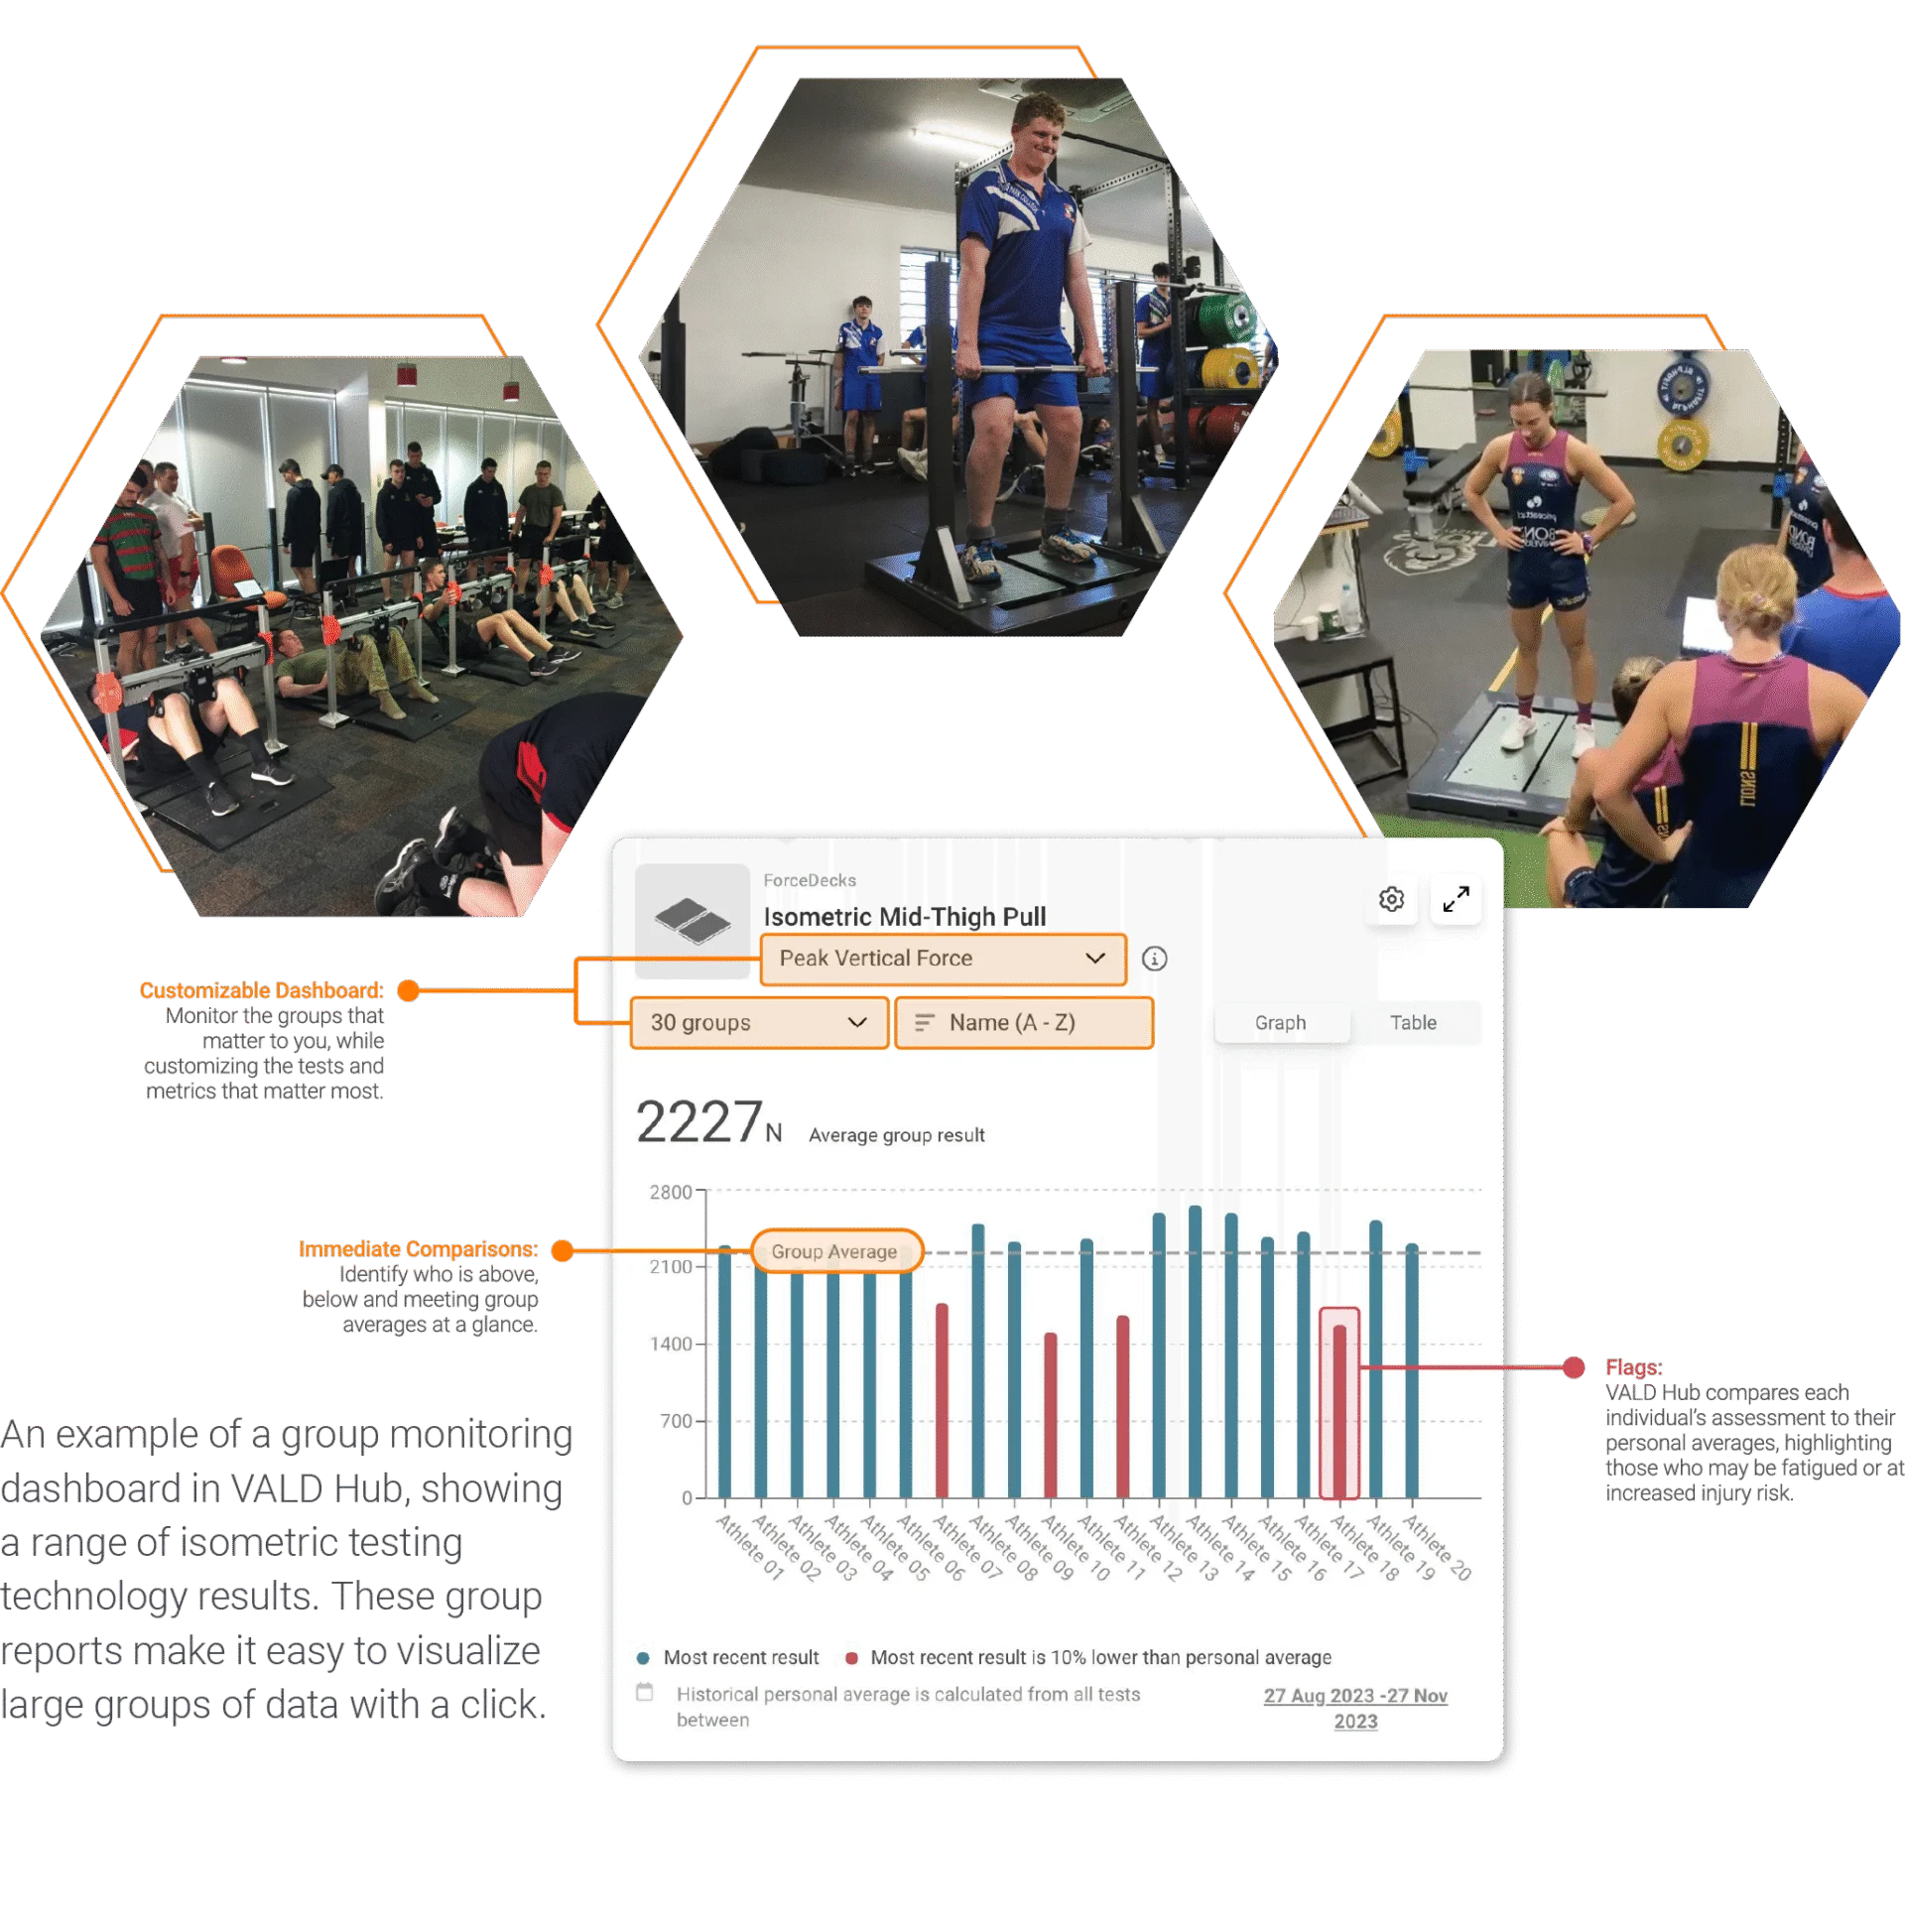
Image of the group monitoring dashboard from VALD Hub
3. Don’t Just Quantify—Visualize
This was a big turning point for me. Numbers are valuable, but the shapes behind them often tell a richer story.
Force-time curves can show you how an athlete produces force—how early they begin to decelerate, how quickly they generate peak force, how clean or chaotic their inter-limb strategies are. Two athletes can jump the same height with entirely different strategies; unless you’re looking at the waveform, you’ll never see it.
This is especially powerful in isometric testing, where rate of force development, time to peak force, and initial strategy are best understood visually. I’ve seen athletes with identical max force values, but very different time to peak— usually meaning one is far more explosive than the other. That’s something you’d only catch if you look at the trace, not just the number.
It’s also critical in rehabilitation settings—where identifying a reloaded but tentative limb is often clearer on a graph than in a number. If you’re reviewing data and ignoring waveforms, you’re leaving insights on the table.
Below are two examples of countermovement jump (CMJ) waveforms where both athletes achieved near similar jump heights, however they had very different strategies. Key insights are compared in the following table;
| Metric | Athlete A | Athlete B |
|---|---|---|
| Bodyweight (KG)* | 89.8 KG | 82.9 KG |
| Jump Height (IMP-MOM) (cm) | 57.8 cm | 58.4cm |
| Eccentric Peak Velocity (m/s) | -1.9 m/s | -2.12 m/s |
| Peak Power/BM (W/Kg) | 71.2 W/Kg | 70.7 W/Kg |
| Eccentric Deceleration Impulse (N s) | 169.7 N s | 176.4 N s |
| Concentric Impulse (N s) | 303.4 N s | 279.4 N s |
| Eccentric Deceleration Phase Duration (ms) | 116 ms | 164 ms |
| Contraction Time(ms) | 632 ms | 794 ms |
* The role of bodyweight must be taken into consideration when analyzing differences between metrics
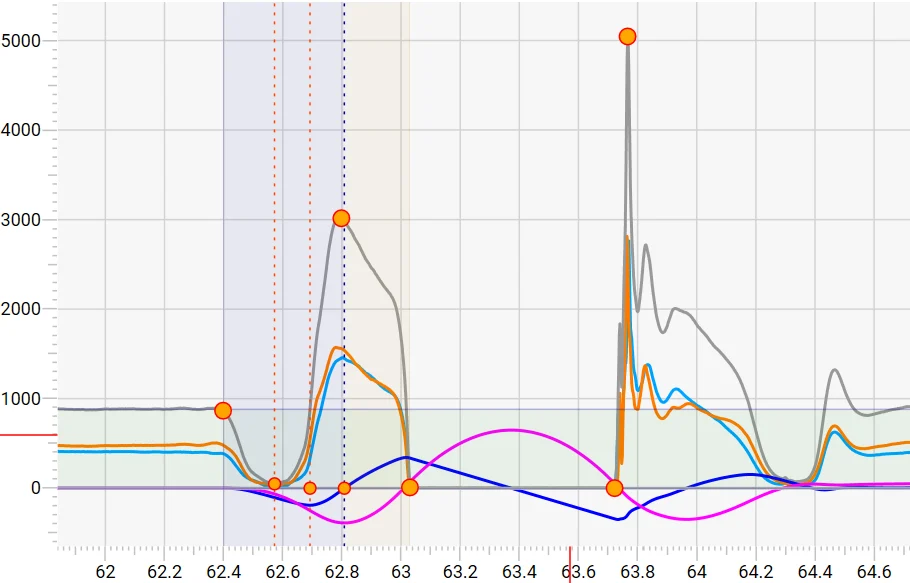 Image waveform from Athlete A
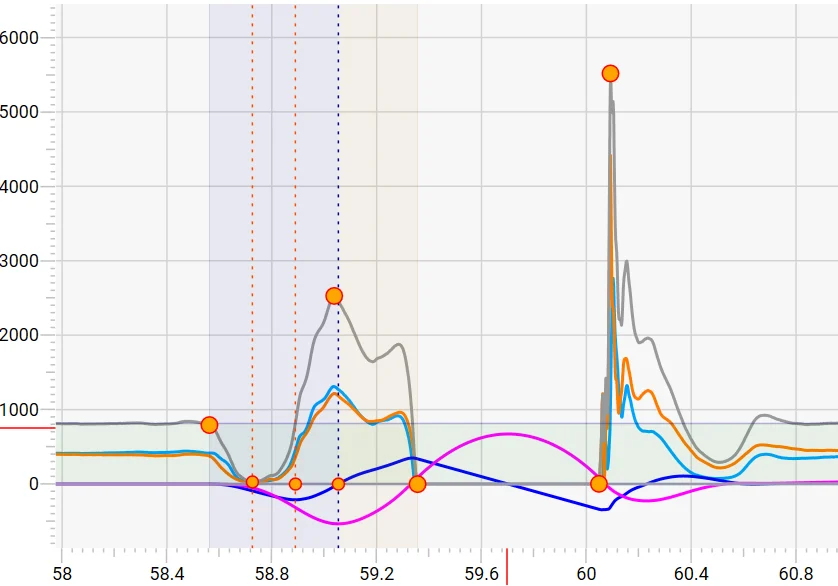
Image waveform from Athlete B
4. Benchmarking is Helpful—Context is Critical
At VALD, we’re often asked, “What’s a good number for this metric?” or “Do you have norms for athletes at this level?”. Fortunately, we have access to the largest dataset in the industry with VALD’s Normative Data available to all clients.
While normative values have their place, I’ve learned to tread carefully when integrating normative data into the conversation. They’re a reference point—not a prescription. What matters is who the athlete is, where they’re coming from, and what they need to be ready for. For example, an elite sprinter may naturally have a shorter contraction time and higher active stiffness than a field sport player Interpreting that without context can lead to faulty conclusions.
I’ve found that the most useful form of benchmarking is a combination of population specific normative data alongside internal comparison:
- How does this athlete compare to their peer group relative to sport, age, sex and where applicable, playing position
- How does this athlete compare to themselves at baseline?
- How do they change across different time points in the season or training week?
- How does their movement strategy change under fatigue?
- How does one limb perform compared to the other?
Norms tell you where someone stands, context tells you why. Use both to make smarter decisions from your testing.
[bctt tweet=”Norms tell you where someone stands, context tells you why. Use both to make smarter decisions from your testing, says Ryan McLaughlin”]
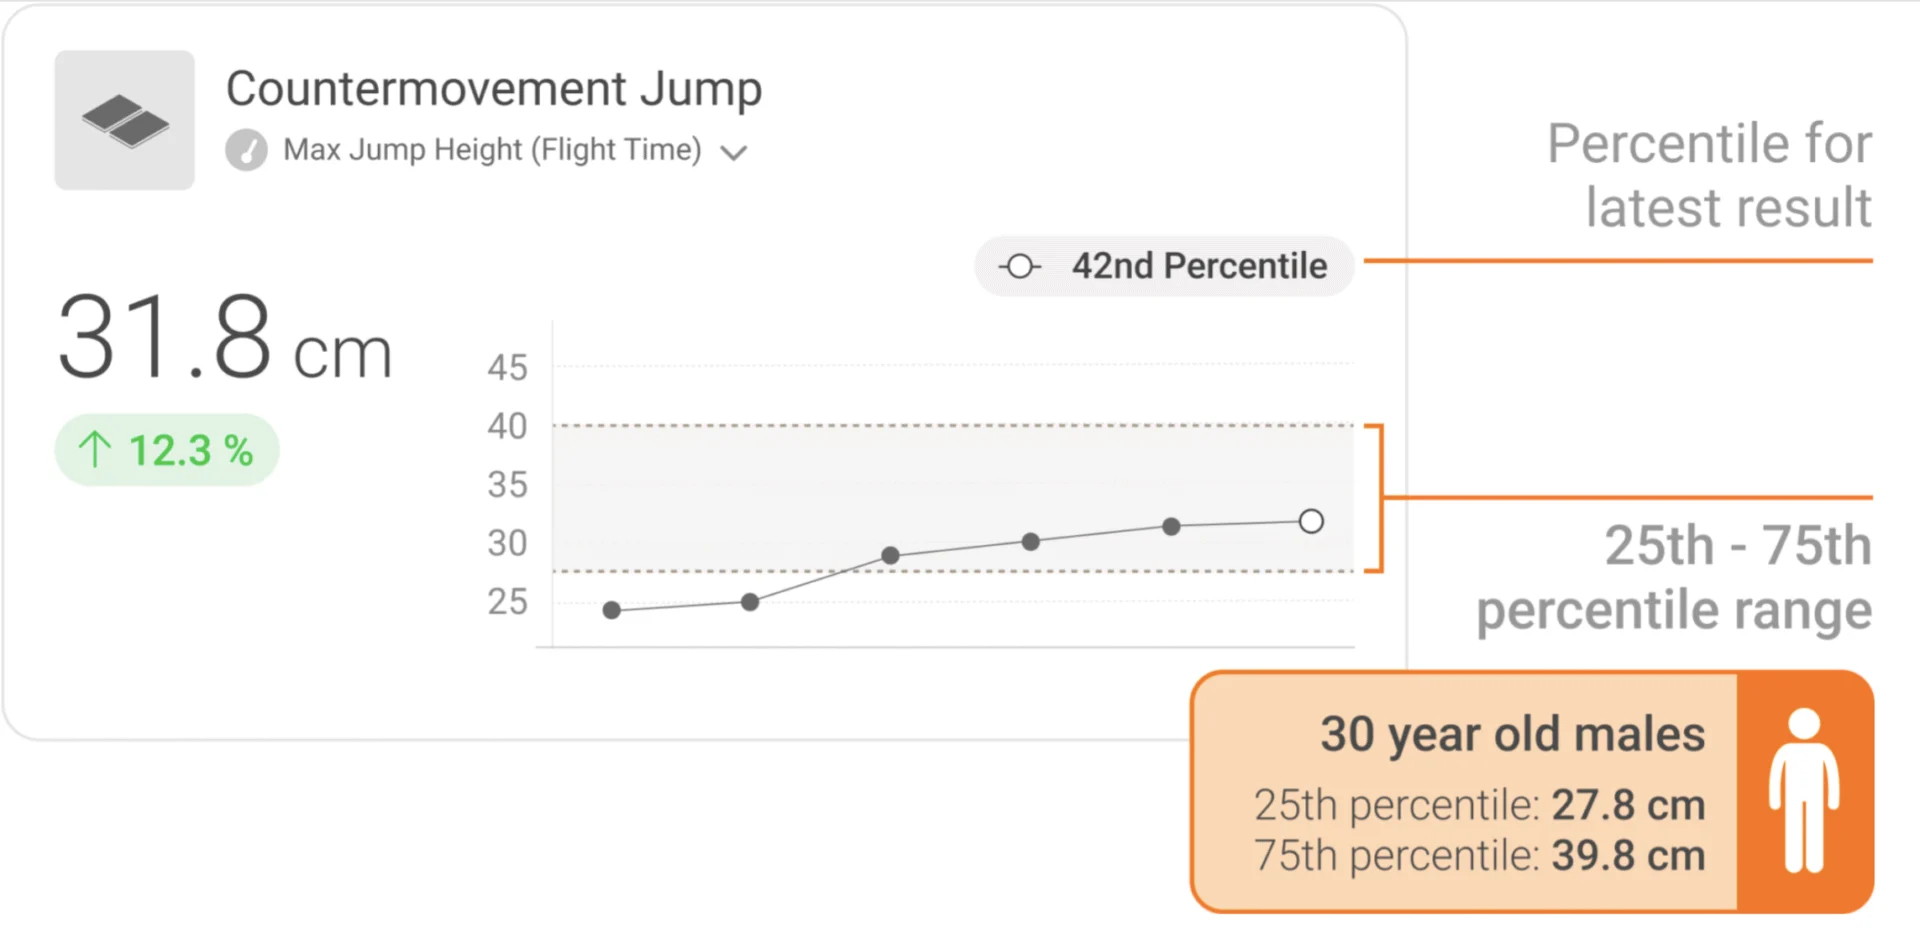 Image of normative data displayed from a ForceDecks test on VALD Hub
5. Consistency Beats Complexity
This lesson has come up repeatedly—especially when supporting teams in high-performance environments with time and resource constraints.
The best testing protocols remain effective from their simplicity and consistency. That means:
- Minimal set up time
- Clear instructions
- A repeatable environment and coaching cues
I’ve seen teams collect less data, more often—and extract far more value than those who go all-in once every few months.
Even from a metric standpoint, this is key. If you’re regularly changing your test setup or how you define metrics—say, fluctuating between jump height calculated by impulse-momentum one week and flight time the next week, or using different timepoints for RFD or impulse —your longitudinal data becomes shaky. Consistency in both collection and computation is what creates clarity. Image of an athlete performing a countermovement jump on ForceDecks
6. Data Should Change Conversations, Not Just Dashboards
ForceDecks produce numbers, but the true impact lies in what happens after the test.
One of the most rewarding parts of my job is hearing how data influences real-world decisions:
- A coach reducing load for the athlete because they’ve identified neuromuscular fatigue in the form of reduced capacity for eccentric deceleration.
- A physio progressing rehab after objective improvements rather than being constrained to ‘time based rehab’
- An athlete gaining confidence because the numbers confirm what they feel.
These moments are subtle, but they’re the reason we collect the data in the first place. Testing should feed the conversation, not replace it.
The data is only powerful if the metrics are understood and trusted. If a practitioner isn’t confident in how peak force or RFD is being calculated—or if the athlete doesn’t buy in—then the test might as well not happen. That’s why metric literacy is just as important as metric collection. I’d recommend digesting the ForceDecks technical metric glossary to help refresh your understanding of the metrics you currently use and may use in the future.
7. Great Tech Is Only as Good as Its Translation
One of the biggest shifts for me over the last few years has been moving from user to educator. It’s one thing to understand testing yourself—it’s another to make it simple and scalable for others.
Alongside providing gold standard technology like ForceDecks, we’ve produced tools and resources like MSK Calculators and The Practitioners Guide Series to support the ongoing learning and exploration from our clients. Personally it’s why I’ve leaned heavily into content, education, and practitioner support. Because no matter how powerful the tools are, they’re only as useful as the clarity with which you communicate them.
When it comes to metrics, that means being clear on:
- What each metric actually represents
- Why it matters in the athlete’s context
- How it should change your decision-making (or how it should not!)
Whether it’s a Premier League physio, an NBA strength & conditioning coach or a local rehab clinician—the goal is always the same: help them make better decisions, faster.
[bctt tweet=”Because no matter how powerful the tools are, they’re only as useful as the clarity with which you communicate them, says Ryan McLaughlin”]
Final Thoughts
Years working with ForceDecks at VALD has taught me a lot. Some of it came from conversations with brilliant practitioners. Some from making mistakes and fixing them. But most of it came from staying curious—about movement, about data, and about how we can better support those on the ground.
If you’re already using force plates, I’d encourage you to zoom out, don’t obsess over any single metric or test, but ask:
- What do we want to know?
- How are we currently answering that?
- How can this tool help us do it better?
At the end of the day, force plates are just that—a tool. They don’t make decisions for you. But when used well, they can sharpen your judgement, strengthen your systems, and help you create environments where performance and rehab are driven by insight, not guesswork.
If we can keep striving for that? Then I’d say we’re on the right track.
Contact:
Email: r.mclaughlin@vald.com
Instagram: @ryan.vald
The post From the Inside Looking Out: What Force Plate Testing Has Taught Me appeared first on SimpliFaster.