
Researchers invented Tensiomyography (TMG) technology in the 1980s, originally for assessing degenerative muscle diseases. However, Mr. Srdjan Djordjevic of Ljubljana, Slovenia, developed its sports application in the 1990s. TMG is a non-invasive, selective muscle function diagnostic tool used by athletes seeking to optimize and maximize their performance, as well as for precise diagnostics of injured muscles.
How TMG Works
The manufacturer designed TMG to be a mobile device. It can travel with the sports team and be quickly assembled at either an indoor or outdoor location (weather permitting), requiring at least 10 x 10 feet of space, most of which is for the athlete/patient to lie down on the table.
The TMG parts are:
- Laptop with TMG software/app
- Electrical stimulator/battery featuring a current strength gauge and power display
- Tripod with a mountable/pivoting arm
- Measurement sensor (attached atop pivot arm)
All the TMG components are interconnected with cables for data transfer.
The TMG also requires a standard-sized massage table where the athlete/patient being tested is positioned during the test, and two disposable, single-use electrodes per person.
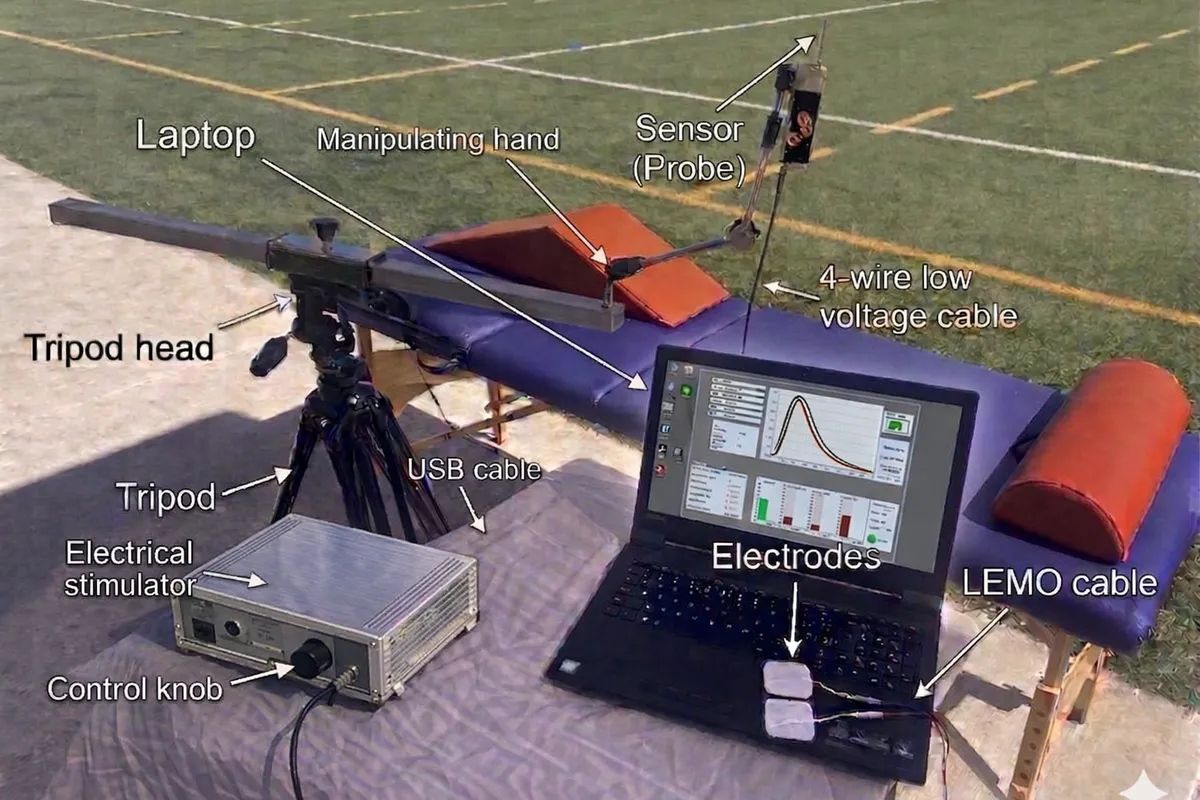
FIGURE 1: TMG components
Two electrodes and a sensor are positioned onto the muscle selected for testing. The sensor sits halfway between the two electrodes. The TMG system operator presses a button to deliver a low-powered electrical current, typically up to 80 milliamperes (mA), through the electrodes and into the muscle, eliciting an involuntary muscle contraction. The operator can adjust the strength of the electrical current via the TMG device. A sensor then measures the tested muscle’s behavior, detecting muscle contraction with 0.001/s (one-thousandth-of-a-second) precision and displaying the results on the computer screen as a graph.
For visual information on how TMG works, watch the videos below.
Video 1: Tensiomyography – Quantifying Muscle Function. Shared with permission from TMG-BMC.
Video 2: Tensiomyography (TMG) basic presentation. Shared with permission from TMG-BMC.
Why Coach My Video App (CMV Pro), and What Is Its Value?
CMV is the most practical and accessible tool currently known to the author for evaluating high-quality sports-related movement videos at up to 240 frames per second (FPS) and for seamless phone or iPad connectivity. Its ability to time to within 0.004/s (four one-thousandths of a second) precision, draw and calculate angles of the user’s choice, forward and reverse videos frame-by-frame, and other useful features makes this technology invaluable for any sports professional seeking to analyze and maximize their athletes’ performance in any sport. The CMV Pro app can be downloaded by clicking on the link below at a one-time cost of $6.99.
CMV Pro: Frame-Frame Video Analysis – CoachMyVideo App – App Store
The acronym list below assists readers in navigating the text.
| Abbreviation | Meaning |
|---|---|
| AAT | Average Air Time |
| ASL | Average Stride Length |
| ASF | Average Step Frequency |
| AT | Air Times |
| BF | Biceps Femoris |
| CM | Control Measurement (Day 1) |
| Dm | Muscle Displacement Magnitude |
| FPS | Frames Per Second |
| GCT | Ground Contact Time |
| GCTA | Average Ground Contact Time |
| Hz | Hertz (frequency unit) |
| m | meter |
| mA | milliampere |
| mm | millimeter |
| ms | millisecond |
| M1 | Measurement 1 (Day 1) |
| M2 | Measurement 2 (Day 2) |
| REF | Reference Value |
| s | second |
| Tc | Muscle Contraction Time |
| Td | Muscle Contraction Delay/Reaction Time |
| Ts | Muscle Contraction Sustained Time |
| Tr | Muscle Contraction Relaxation Time |
| TMG | Tensiomyography |
What Is the Purpose of This Pilot Experiment?
The author wanted to conduct his own test to assess the TMG’s measurement sensitivity under the efforts typically produced in sprinters’ practices and compare the results with key performance indicators. The author obtained TMG data from one athlete, testing the most used muscle in running: the biceps femoris muscle (BF). This pilot experiment involved only the left BF. To further support findings, the author used the CMV app to record and calculate stride pattern key performance factors using a 240 FPS video recording.
Data Collection Procedures
The author performed three identical TMG data collection procedures during all three data collection sessions. The author set up the TMG testing station immediately next to the running track to test the athlete (subject) as quickly as possible upon completion of the running task, ensuring data validity. The difference between each of the three data collections was the athlete’s state of fatigue and the type of fatigue.
The operator positioned the electrodes and the TMG sensor at the predetermined markings on the subject’s left BF muscle before the electrical current delivery (Figure 1). This preparation for TMG measurement was essential for data validity, as the experiment aimed to extract the BF contractile properties as quickly as possible upon cessation of the running effort for sessions two and three. Testing muscles while fatigued was the key detail in this pilot experiment for ensuring the data’s validity.
For testing sessions two and three, the time between the end of each running set and TMG data collection was the time it took the athlete to walk to the testing area and get the TMG measurement components attached to the skin. Those times were measured as follows: Day 1: 38 sec., and Day 2: 42 sec.
On each day, as a part of the testing preparation routine, the operator measured the length of the left BF muscle at 34cm. The midpoint between the ischial tuberosity and the fibula head, where the TMG measurement sensor was positioned, was marked at 17cm from each end. The operator positioned two electrodes parallel to each other, 2.5cm proximally and distally from the sensor marker, totaling a 5cm distance between them (Perotto, 2011, p. 229). The operator marked the exact sensor placement position with a dot and drew straight lines across the left leg to indicate the inside borders for the electrode positioning.
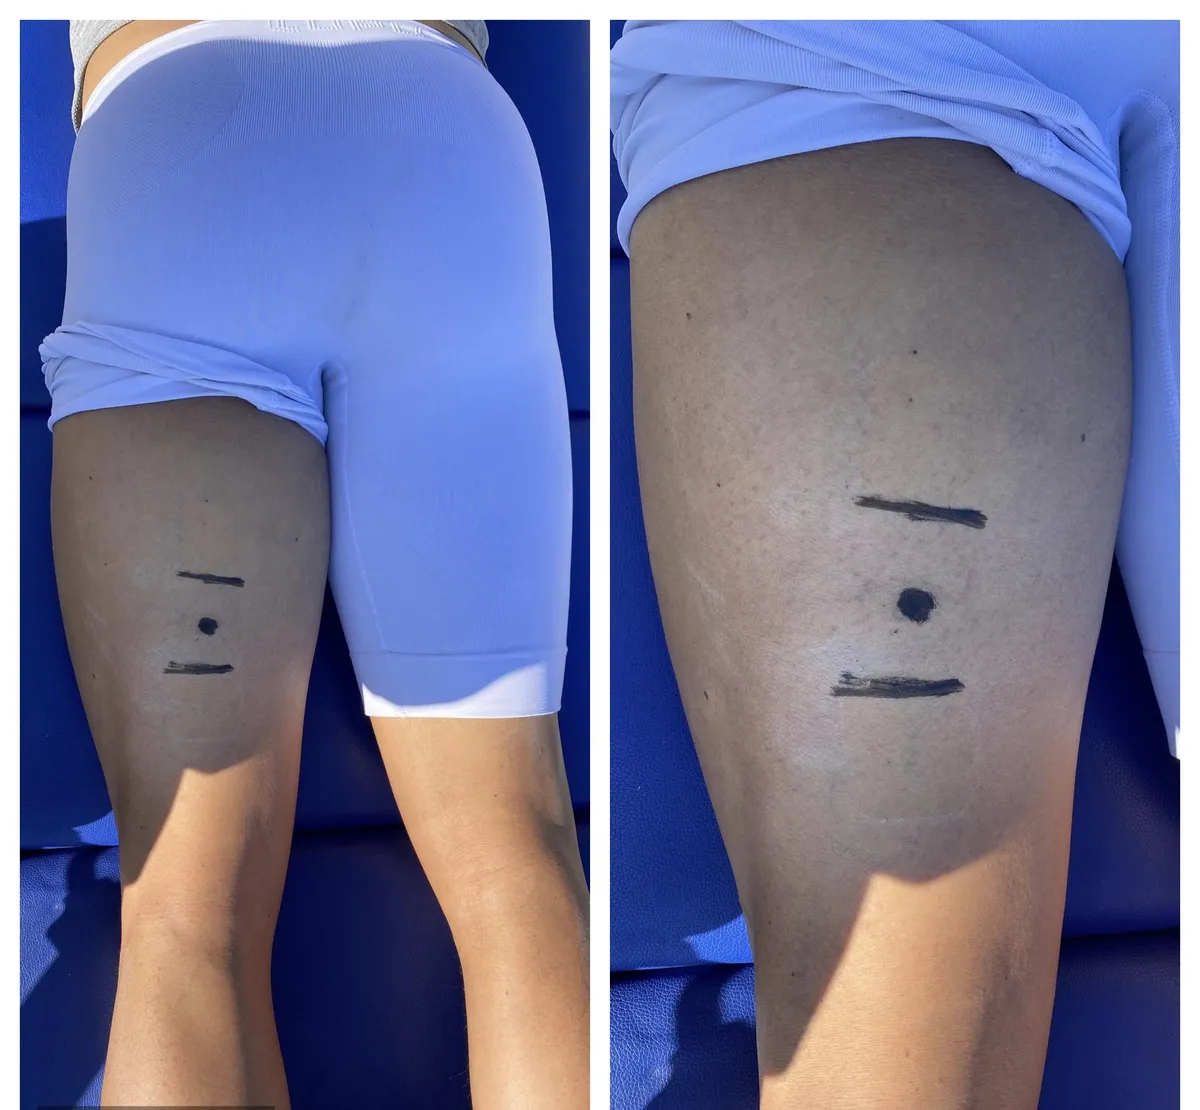
FIGURE 2: (L-R) A further and closer look at the pre-assigned TMG sensor and two electrodes positioning
The author performed the first, or control, TMG data collection session under a fully rested state. One day of rest separated data collection sessions two and three to ensure data validity by providing the athlete with ample recovery time between efforts.
Following the standardized positioning protocol, the operator placed the electrodes 5cm apart (Figure 1) and placed the TMG data collection sensor perpendicular to the skin on the BF muscle at the midway point between the electrodes (Schwiete et al., 2023). The testing subject lay in a prone position with ankles placed on the standard TMG foot cushion, resulting in a knee flexion angle of approximately 5° (Schwiete et al., 2023). The operator performed the TMG measurement procedure twice per muscle during each testing session, using an electric charge of 70 mA followed by 80 mA, with a five-second break between the two TMG tests to allow for complete muscle relaxation. The tests at 80 mA produced better results, and the author used them for data presentation.
Data Collection Details
The entire data collection was spread over two days and three sessions:
Day 1, Session #1: The first or the control measurement (CM) was performed on the left BF muscle, without the presence of fatigue.
Day 1, Session #2: Post-maximal speed running effort (alactic metabolism dominant effort). The second session included two maximal speed sprints of 20m (flys). Clearly visible cones and tape marked the start, fly zone beginning, and end across the lane where the subject ran. For marking and video recording details, see:
Maximal Sprint Speed: Evaluating 10m Flys Under Different Conditions.
Including the acceleration zone of 30m, the distance per run was 50m. Rest time between runs was five (5) minutes. The author video-recorded each run at 240 FPS, video-timed the 20m fly zone, and collected a sample of six consecutive steps and their Ground Contact Times (GCT) for data presentation. For this purpose, the 20m fly timing zone begins and ends when the athlete’s chest crosses the 20m zone markings.
Video 3.
Day 2, Session #3: Post-anaerobic-lactic focused running effort (relatively low volume). This session involved running five (5) sets of back-and-forth runs of 80 meters, followed by 20 seconds of rest after each run. Starting and finishing lines on the track were marked with clearly visible cones in addition to the painted markings on the track. The athlete was instructed to run the same times for each of the 5 x 80m runs, or as close as possible. The author timed all runs and rest times with a hand stopwatch. During the last, fifth run, six steps between the 60th and 80th meters of the running zone were video-recorded and timed with CMV at 240 FPS. The reason for the GCT timing at the end of the last run was to obtain data under maximally fatigued conditions during this set and compare the data to the maximal running speed performance indicators (Table 3). This type of effort contrasts with the session two efforts and is considered moderate intensity due to the fatigue factors. Although not directly relevant to this study’s outcome, the times the subject ran during this set are presented in Table 1.
Video 4: Day 2: last 20m fly during 5 x 80m interval
| Rep # | 1 | 2 | 3 | 4 | 5 |
|---|---|---|---|---|---|
| Time (s) | 10.4 | 11.44 | 11.63 | 11.91 | 11.57 |
This type of effort is considered to have significantly lower intensity than a maximal speed run, predominantly anaerobic-lactic production/tolerance metabolism type. The volume during this type of effort in this pilot experiment is perceived as minimal. The data serve only as an example and provide insight into how this type of running effort influences the BF muscle contraction, as measured with TMG.
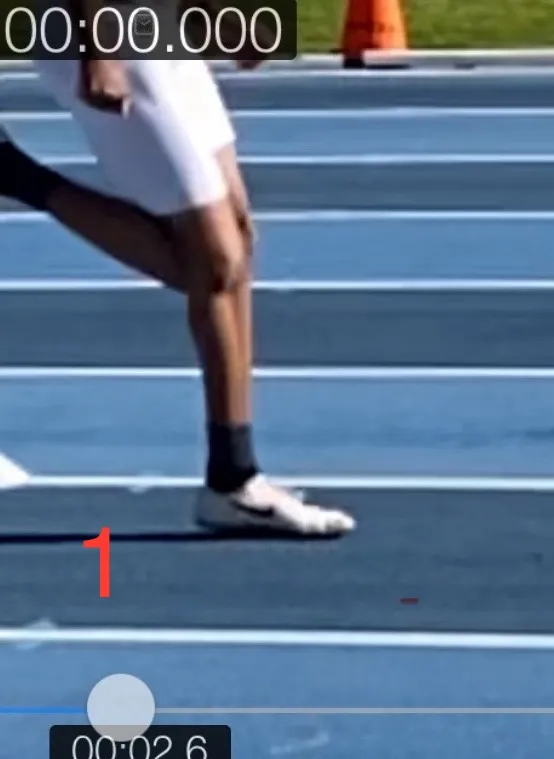
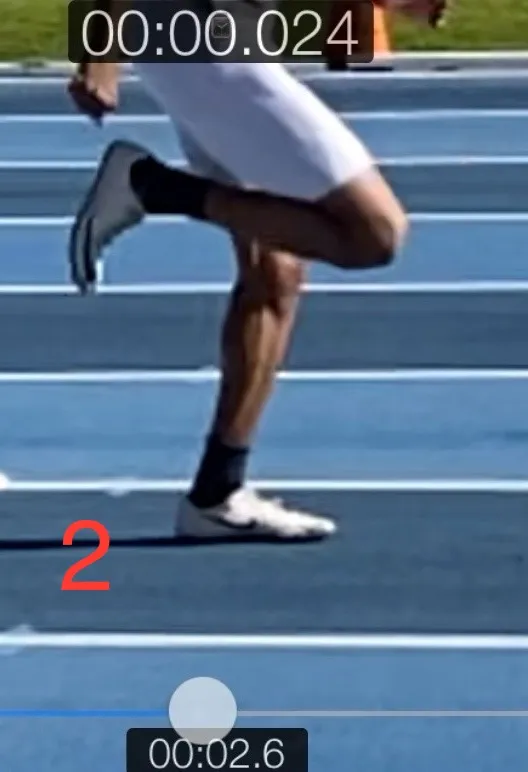
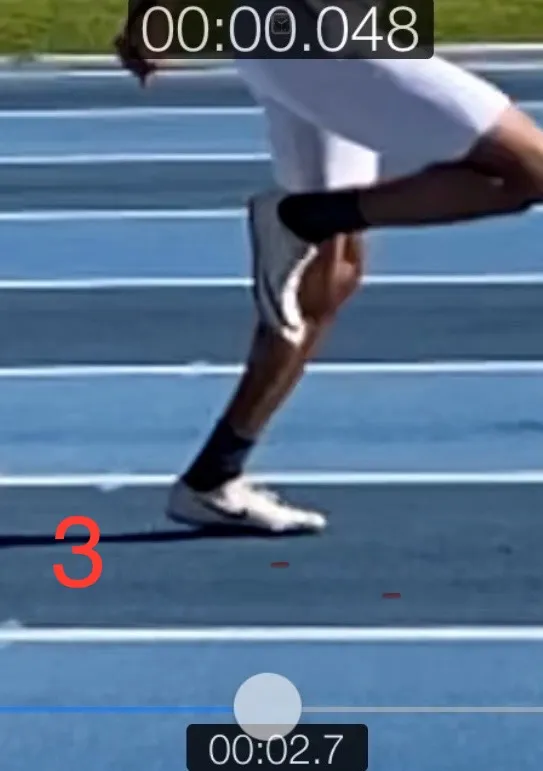
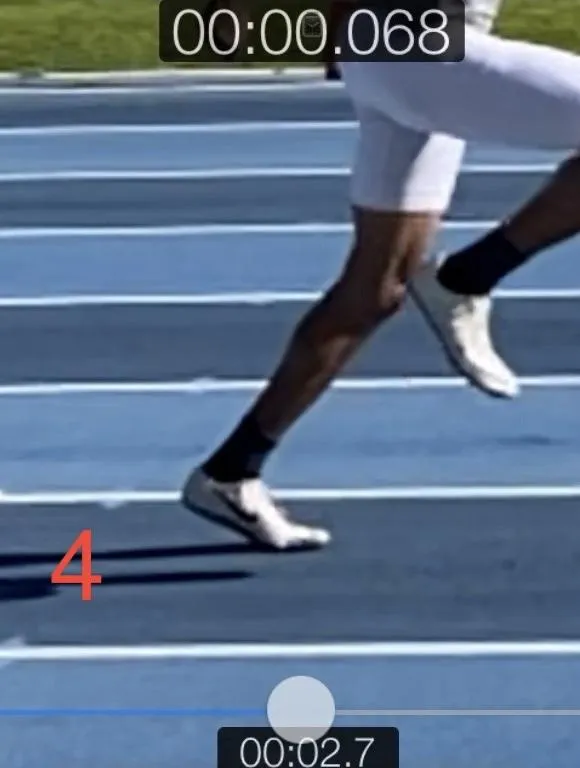
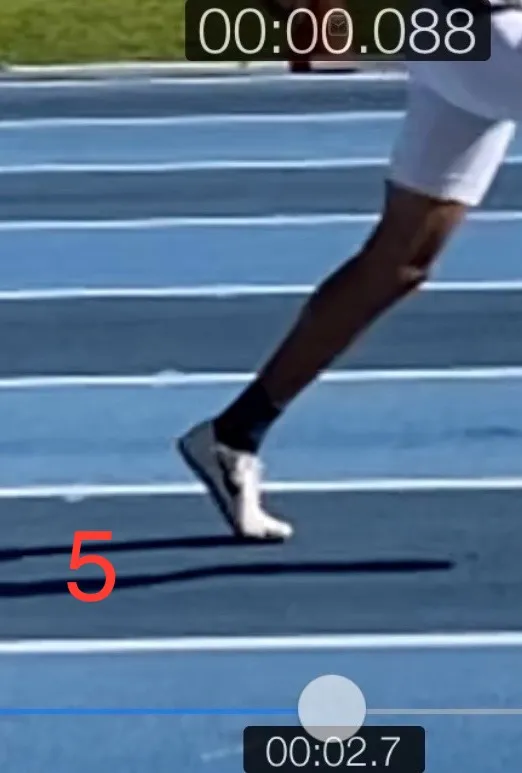
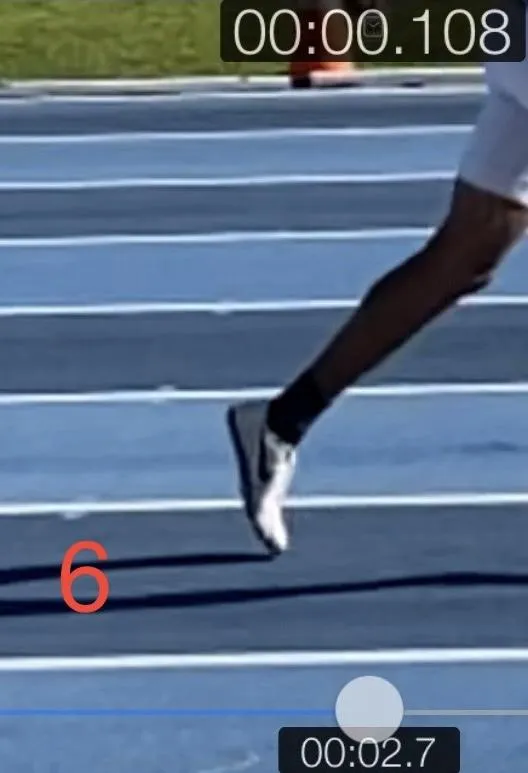
FIGURE 3: GCT measurement example; Photosequence 1-6 of the athlete’s left foot shows ground contact phases during maximal running speed and how the time is measured on the CMV application. The 240 FPS video quality provides four one-thousandths of a second (0.004) per frame timing precision. The GCT is shown at the top of photosequence #6
Test Results
The TMG parameters presented are: Td, Tc, and Dm.
CMV parameters presented are: 20m fly time, average ground contact time (GCTA), average air time (AAT), average step frequency (ASF), and average stride length (ASL) – all calculated from the 6-step sample average.
*All percentages in tables are rounded to the nearest tenth
|
TMG |
REF |
CM |
M1 |
M2 |
|---|---|---|---|---|
|
Td (ms) |
21.35 |
25.33 |
22.04 |
24.60 |
|
Tc (ms) |
25.74 |
21.98 |
18.57 |
22.81 |
|
Dm (mm) |
2.21 |
3.49 |
3.75 |
2.76 |
TABLE 2-A: A) Ref: TMG reference value, B) CM; Control measurement – Day 1
C) M1; Post Alactic Effort Measurement – Day 1, D) M2; Post Lactic Effort Measurement – Day 2
|
TMG % |
REF |
CM |
M1 |
M2 |
|---|---|---|---|---|
|
Td (ms) |
100 |
18.6 |
3.2 |
15.2 |
|
Tc (ms) |
100 |
-14.6 |
-17.9 |
-11.4 |
|
Dm (mm) |
100 |
57.9 |
69.7 |
24.9 |
TABLE 2-B: Values are derived from Table 2-A. Percentages were calculated from reference values (REF).
*Negative Tc values indicate better results than the reference
|
CMV |
M1 |
M2 |
Diff. % |
|---|---|---|---|
|
Fly Time (s) |
2.233 |
2.672 |
19.7 |
|
GCTA (s) |
0.108 |
0.135 |
25.0 |
|
ASF (Hz) |
4.12 |
3.37 |
18.2 |
|
ASL (m) |
2.17 |
2.22 |
-2.3 |
TABLE 3: 20m flying from a 30m approach – M1 and M2 running quality parameters measured with CMV application at 240 FPS. Differences are expressed as %
*For ASL, M2 is better than M1 by 5cm or 2.3% on average.
The 6-step GCT sample during 20m fly runs from which GCTA was calculated is presented in Table 4. The 6-step Average Air Times (AAT) are presented for informational purposes only, as they do not directly influence sprint speed quality parameters.
|
CMV |
GCTA (s) |
AAT (s) |
|---|---|---|
|
Alactic Run |
0.108 |
0.135 |
|
Lactic Run |
0.126 |
0.149 |
|
Difference % |
14.3 |
9.4 |
TABLE 4: Average 6-step Ground Contact and Air Times for left and right foot combined (3 left foot steps + 3 right foot steps counted during running) under Alactic and Lactic efforts comparison. The differences in values (%) show the performance decline during Lactic Run metabolism.
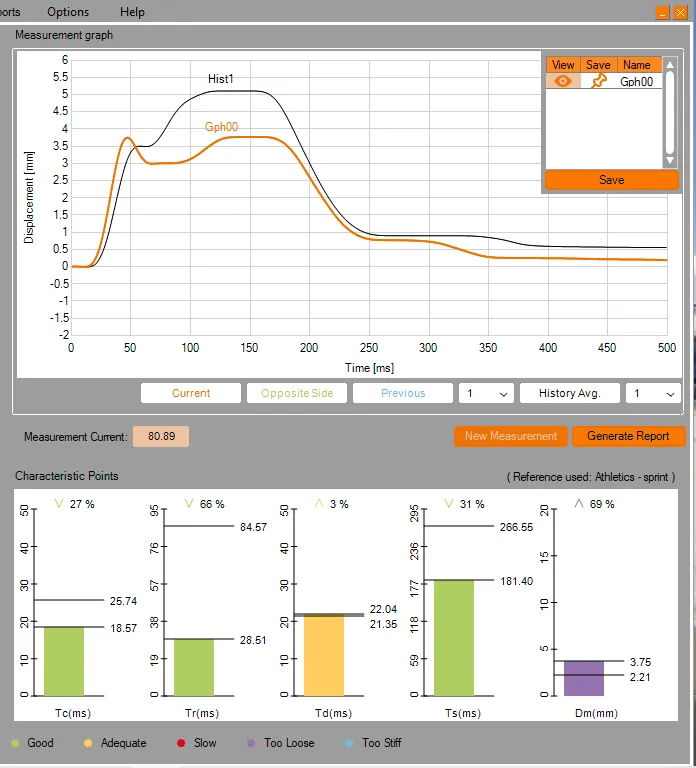
FIGURE 4: TMG data; Left BF, as seen immediately post control measurement (CM) completion, before the report is created
TMG and CMV Data Comparison
As expected, all three TMG parameters considered (Td, Tc, and Dm) showed better values after the absolute sprint/alactic running effort measurement (M1) compared to the control measurement (CM) and after the lactic effort (M2). The author did not consider the parameters measuring muscle contraction sustained and relaxation times (Ts and Tr), as they were not relevant for this purpose.
According to the results, with the sole exception of stride length (ASL), all evaluated parameters performed uniformly better during the maximal speed test in both TMG and CMV (M1) than during the anaerobic-lactic focused effort (M2). Comparison of M1 and M2 shows that the only TMG-tested muscle (left BF) had a Td that was better by 12.0%, a Tc better by 6.5%, and a Dm better by 44.8%. These differences reflected the velocity difference of 19.7% between maximal speed and anaerobic-lactic metabolism running effort. GCTA and SF parameters also follow the same pattern, with 25.0% and 18.2% differences in favor of the maximal speed run.
Based on the results, this pilot study shows a correlation between the single TMG tested muscle behavior pattern (left BF muscle) and CMV results.
It is logical to assume that if this test were to be performed on all major agonist muscles of an athlete, the TMG vs CMV change would show even greater correlation.
The subject tested produced better results during the control measurement (CM) in Tc and Dm than REF, but not Td (including Ts and Tr), indicating that Tc and Dm are the two most relevant parameters for this type of assessment. The Td parameter would become more applicable when assessing reaction speed to the starting signal, fast stop-and-go, or sudden changes in movement direction. Those specific efforts are regularly present in sports such as football, soccer, basketball, tennis, hurdle running, and field events in track and field (i.e., long jump, high jump, shot put), among others.
When an athlete produces intense physical efforts near or at their peak athletic abilities, such as sprints, those efforts should also be understood as activities providing the Post Activation Potentiation effect. Resisted Sprints and Post-Activation Potentiation – SimpliFaster
To reiterate, maximal running velocity (or maximal physical effort intensity of any type in any sport) can only be produced without the presence of fatigue (Day 1 effort).
During the Day 2 effort, the lactate generated negatively impacts muscle contractile properties. Because anaerobic-lactic metabolism, when focused, achieves lower intensity and has a longer-lasting capacity to sustain work, coaches must understand and consider its impact in its entirety when prescribing training programs.
*Understanding the above paragraph in depth is crucial for a coach of any sport at any level.
Collected Data in Practical Use
The TMG system comes with a library of videos/exercises designed to focus maximally on a particular muscle and improve the specific function required to reach maximal athletic potential. The TMG’s inventor developed those exercises and selected them as the best ones addressing the type of muscle function that needs improvement.
After the TMG report is complete and intervention exercises are selected, it is up to the coach or physical therapist to implement those exercises into the training program.
By collecting, analyzing, planning, and executing training interventions based on the TMG and CMV data, the training program has the potential to reach the level of coaching expertise.
Examples of Possible Real-Life Scenarios
1. When a coach receives a TMG report showing a deficit in Tc or Dm for a particular muscle, what does the decision-making process look like for selecting an intervention?
The coach (and the coaching/medical support team) must decide upon the best training intervention strategy based on the TMG or CMV tests and each athlete’s individual performance, health status, and needs. The Tc and Td values can be either good, adequate, or inadequate. The TMG video library, which is a part of the system, can also be consulted when adjusting training.
For examples of possible interventions and training ideas related to the BF muscle, please refer to Table #5.
2. How might a coach use the comparison between TMG data and high-speed video metrics to adjust a training block mid-season?
The TMG report shows the optimal values for each athlete or team tested. The coach should have their athletes’ seasonal maximal speed times (flying 10, 20, and 30m), GCT, AT, SF, and SL parameters documented and ready for comparison with TMG values, looking for areas for improvement.
Training of a particular muscle’s reaction contraction times (Tc and Td) can be included during warm-ups, usually 1-2 sets of a specific exercise performed before the onset of fatigue. The muscle size/tone training (Dm) requires a resistance-type stressor. In that case, a coach should carefully consider the competition schedule and then decide by what means a specific resistance stressor intervention quantity, or type, can be added mid-season.
3. Are there specific scenarios where TMG data changed your programming decisions for an athlete?
Example 1: Most recently, I performed a full-body TMG assessment on a 24-year-old elite male hammer thrower and found that in most muscles, his Td and Tc were inadequate for his level of sport excellence. Since I don’t coach this athlete, I only made him aware of this finding and recommended specialized exercises from the TMG library. His 2-month training camp showed the following improvements after a 3-month retest.
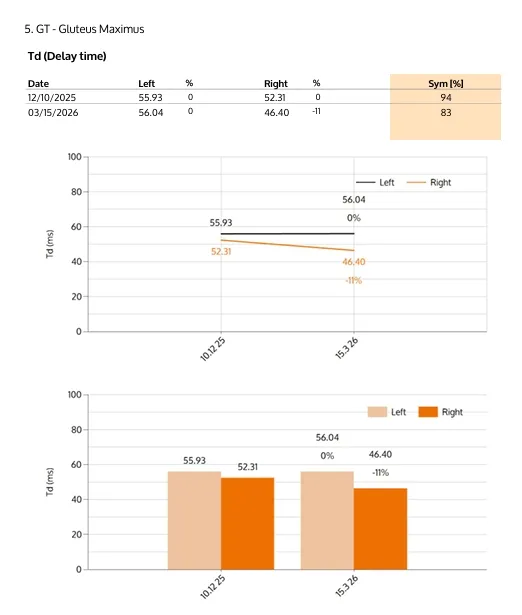
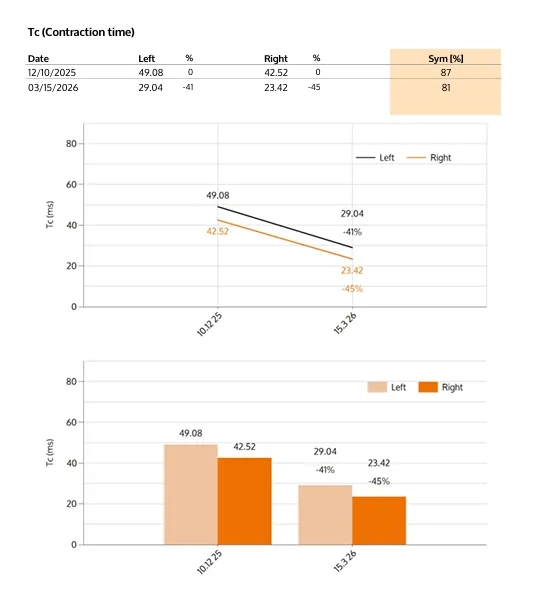
FIGURE 5: Two TMG tests performed three months apart, before and after the 2-month-long intense training camp. Following the first assessment, the athlete was familiarized with the functions needing improvement. The training camp was conducted exclusively by his coach.
Example 2: The author TMG-tested twelve collegiate mid-distance runners on major muscle groups (11 muscle pairs) and created a group report using the 12-athlete average values for each muscle pair. The group report revealed Tc value deficiencies in particular, and the author implemented the appropriate intervention, focusing on the target muscle groups. As is common in mid-distance and distance runners, the most important learning experience for this group was learning to perform training efforts without fatigue, allowing for maximal possible movement velocity. This test and training intervention made the athletes aware of areas to improve their performance and taught them specific warm-up strategies. The mid-season training addition focused on improving Tc but did not change the athletes’ training or competition schedule. In addition to each individual’s report, the author created the team report because logistics allowed for training adjustments only in the team training setting.
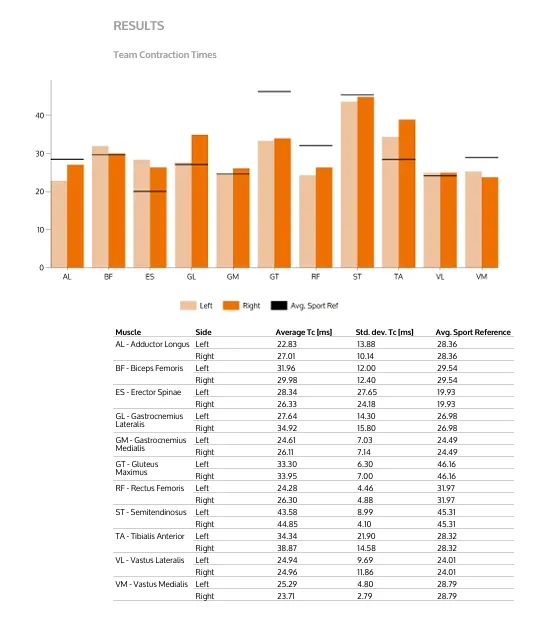
FIGURE 6: Full-body team report of the mid-distance runners training group
|
TMG |
Deficiency |
Exercise Idea #1 |
Exercise Idea #2 |
Exercise Idea #3 |
|---|---|---|---|---|
|
Tc |
Too Slow |
Light weight fast ham. curls |
Body weight split jumps |
Light weight squat jumps |
|
Dm |
Too Small |
Body weight 1-leg hip raises |
Machine 1-leg ham. curls |
1-legged dead lifts |
|
CMV |
Deficiency |
Exercise Idea #1 |
Exercise Idea #2 |
Exercise Idea #3 |
|
GCT |
Too Slow |
Jump rope |
Fast box jumps |
Overspeed cord sprints |
|
SL |
Too Short |
Uphill runs |
Weighted sled runs |
Bounds |
|
SF |
Too Low |
Wicket runs 5.5 -6.5 ft apart |
Curved treadmill |
Overspeed cord sprints |
TABLE 5: Simplified summary of the commonly encountered performance deficiencies in healthy athletes requiring improvement according to the TMG and CMV performance measurement parameters and three examples of immediately applicable training intervention ideas based on those performance deficiencies. The table shows three possible intervention progressions for each function.
Number of reps/sets, specific exercise choice, order, and exercise progressions are up to the coach to fit into the training program.
* The TMG-measured performance inadequacies can be established based on either the respective muscle’s reference values or compared to the athlete’s previous testing results.
** Specific muscle reaction time (Td) focused exercises often overlap with contraction time exercises (Tc), and are purposely omitted in this table for that reason
*** TMG: Inspired by and adopted from the TMG-BMC video library
****CMV: (Korchemny & Hoskisson, 1994, Mann & Murphy, 2022)
For a full insight into an athlete’s performance, the coach should extract TMG data from all relevant muscles for the respective sport and the athlete’s specialty position (not only one muscle, as in this pilot experiment, which was meant to create awareness). For sports performance-related purposes, the TMG inventor recommends three tests per season, spaced approximately three months apart to allow time for the training intervention to show improvement. For post-injury recovery monitoring, the affected muscle(s) can be tested as needed, as the TMG is a non-invasive procedure that does not depend on an athlete’s motivation or ability to create movement.
The coach should conduct high-speed video recordings (CMV) and specialty tests corresponding to the activity an athlete is preparing for regularly, recording, analyzing, and documenting the results. Scheduling re-evaluations as a part of a yearly program or as needed is up to the coach.
References
Korchemny, R. and Hoskisson, J.L. (1994). Innovations in speed development, an advanced model. (pp. 65-70). Dr. Remi Korchemny, 6435 Ridgewood Drive, Castro Valley, California 94552.
Mann, R. and Murphy, A. (2022). The Mechanics of Sprinting and Hurdling. Independently published.
Perotto, A. O., M.D. (2011). Anatomical Guide for the Electromyographer. The Limbs and Trunk (5th ed., pp. 228-229). Charles C Thomas Pub Ltd.
Schwiete, C., Roth, C., Braun, C., Rettenmaier, L., Happ, K., Langen, G., & Behringer, M. (2023). Sensor location affects skeletal muscle contractility parameters measured by tensiomyography. PLOS ONE, 18(2), e0281651. https://doi.org/10.1371/journal.pone.0281651
The post Sprinting Quality Parameters Comparison with Tensiomyography and High-Speed Video appeared first on SimpliFaster.